Confidence Intervals
A confidence interval (CI) is a statistical tool used to estimate the range within which a population parameter (like a mean or proportion) is likely to fall, based on information from sample data1. This interval is constructed around the sample estimate and provides an indication of where the true parameter might be with a certain level of confidence, usually expressed as a percentage like 95% or 99%.2
Table of contents
To calculate a confidence interval, you typically need the sample mean (which provides a central estimate), the standard deviation (which measures the spread of the data), and the sample size (the number of data points). For proportions, you use the sample proportion instead of the mean. The formula for a confidence interval generally involves the sample statistic plus or minus a margin of error (Eq. 1), which is derived from the standard deviation and the sample size, adjusted by a factor from a statistical distribution (like the Z-score in large samples or the t-score in smaller samples)1,2.
The confidence interval when considering sample data is calculated based on below formula:
where \(\begin{equation} \overline{x} \end{equation}\) is the sample mean, $s$ is the standard deviation of the sample data, $n$ is the sample data size and \(\begin{equation}t_{\text{critical}} \end{equation}\) is derived from the t-distribution, which accounts for degrees of freedom (df) that depend on the sample size and is found using Eq. 2 when confidence level is for example 95%:
where \(\begin{equation}df=n-1\end{equation}\) and $\alpha$ is the significance level which is calculated as \(\begin{equation}\alpha=1-\text{confidence level}\end{equation}\). The value \(\begin{equation}\frac{\alpha}{2}\end{equation}\) reflects the two-tailed nature of the typical confidence interval (e.g. for 95 % confidence interval, \(\begin{equation}\alpha=0.05\end{equation}\) and \(\begin{equation}\frac{\alpha}{2}=0.025\end{equation}\)).2
The confidence interval when considering population data is calculated based on Eq. 3:
Where $μ$ is the population mean, $σ$ is the standard deviation of the population data, $n$ is the population size and \(\begin{equation}Z_{\text{critical}}\end{equation}\) is derived from the standard normal distribution (Z-distribution), which is symmetric and has a mean of zero and a standard deviation of one. The \(\begin{equation}Z_{\text{critical}}\end{equation}\) value for a given confidence level is:
Where \(\frac{\alpha}{2}\) again accounts for the two-tailed nature of the test or interval. For a 95 % confidence interval, you look up or calculate the Z-value that corresponds to 97.5 % of the distribution (since 2.5 % is in each tail).2
The confidence interval when considering population proportion is calculated based on Eq. 5:
where $p$ is the sample proportion and is calculated as \(\begin{equation}p = \frac{X}{n}\end{equation}\): where X is the number of successes in the dataset and n is the total sample size.
Isalos offers three methods for calculating confidence intervals. The first method involves inputting raw (sample) data, assumed to be a representative sample. In this method, the mean can be automatically calculated, and the user has the option to manually input the standard deviation value or allow the software to calculate it automatically. This flexible approach allows for accurate estimation of confidence intervals based on the provided sample raw data. The second method requires the user to manually enter the mean value, standard deviation, and sample size. Additionally, the user must indicate whether the data represents a sample or population. The third method calculates confidence intervals based on proportions. Here, the user needs to specify the probability and sample size.
These different calculation options in Isalos provide flexibility and accommodate various scenarios for estimating confidence intervals with ease and accuracy. All the above three options allow the user to manually specify the confidence level.
Raw Data
As previously mentioned, the confidence intervals can be calculated using input raw (sample) data. The mean is automatically calculated, and the user has the option to manually enter or automatically calculate the standard deviation of the sample data. Additionally, the user can specify the desired confidence level for the calculation of the confidence intervals.
Use the Raw Data function for calculating confidence intervals by browsing in the top ribbon:
| Statistics \(\rightarrow\) Confidence Intervals \(\rightarrow\) Raw Data |
Input
Users are allowed to input numerical values in any columns of their choice, without being constrained by specific limitations on the number of columns. It is important to note that the calculation will be rendered unable to be performed if categorical or text data is inserted.
Configuration
| Confidence level (α) | Manually insert confidence level which may range from 0 to 100. |
| Standard Deviation Method | Select any of the two options available, user-defined (Select by the user) or calculate the standard deviation based on the provided data (Autocalculate from input data). |
| Standard Deviation | If the previous option, Select by the user is chosen then enter manually the value that represents the standard deviation of the sample data. |
| Include/exclude columns | Select manually the columns that are going to be used for the calculation of the confidence interval through the dialog window: Use the buttons to move columns between the Included Columns and Excluded Columns list. Single-arrow buttons will move all selected columns and double-arrow buttons will move all columns. |
Output
The confidence interval is computed for each selected column, and the resulting values are presented in the output data sheet. Specifically, the lower limit is displayed in one row, while the upper limit is presented in another row.
Example
Input
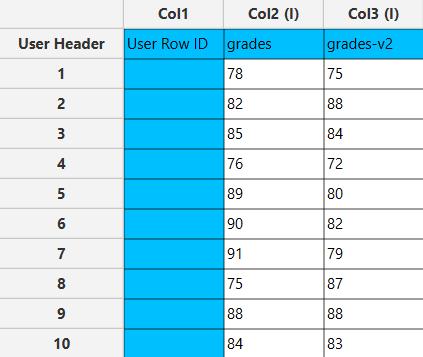
In the left-hand spreadsheet, each column specifies a data set for which we are interested in performing calculations for confidence intervals.
Configuration
- Select
Statistics\(\rightarrow\)Confidence Intervals\(\rightarrow\)Raw Data. - Select
Confidence Level (α)[1]. The value will range from 0 to 100. - Select one of the two available options for the
Standard Deviation Method[2]: eitherAutocalculate from input dataorSelect by the user. If you choose the option toSelect by the user, enter the value of theStandard Deviation[3]. - Select the columns that are going to be used in the calculation by clicking on the arrow buttons [4] and moving columns between the
Excluded ColumnsandIncluded Columnslists. - Click on the
Executebutton [5] to apply the confidence intervals calculation on the selected columns.

Configuration
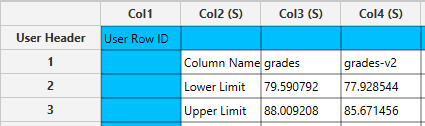
The output data of the calculation is presented in the right-hand spreadsheet of the tab, displaying the “Lower Limit” and “Upper Limit” for each selected column. These values indicate the range of the confidence interval.
Sample Size, Mean and Standard Deviation
This method offers the flexibility to the user to input the desired sample size, mean, and standard deviation, and to choose between sample data or population data representation. The user can also specify the confidence level.
Use the Sample Size, Mean and Standard Deviation function for calculating confidence intervals by browsing in the top ribbon:
| Statistics \(\rightarrow\) Confidence Intervals \(\rightarrow\) Sample Size, Mean and Standard Deviation |
Input
No input data are needed to use this function.
Configuration
| Confidence level (α) | Manually insert confidence level which may range from 0 to 100. |
| Sample size (n) | Insert the number of data points in the dataset. |
| Mean ($\overline{\text{x}}$) | Type the mean value of the dataset. |
| Population/Sample | Select any of the two options available, σ or s that denotes that the dataset is population or sample data, respectively. |
| Standard Deviation | Type the value that represents the standard deviation of the data. |
Output
The output datasheet presents the Lower Limit and Upper Limit values in separate rows.
Example
Input
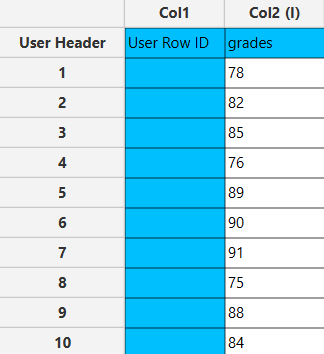
The left-hand spreadsheet contains a column that is populated with the necessary data for calculating the confidence interval.
Configuration
- Select
Statistics\(\rightarrow\)Confidence Intervals\(\rightarrow\)Sample Size, Mean and Standard Deviation. - Type the
Confidence Level[1]. The value will range from 0 to 100. - Type the
Sample Size (n)[2]. - Type the
Mean ($\overline{\text{x}}$)[3]. - Select one of the two available options for the
Population/Sample[4]: eitherσorsthat denotes that the dataset is population or sample data, respectively. - Click on the
Executebutton [5] to apply the confidence intervals calculation.

Output
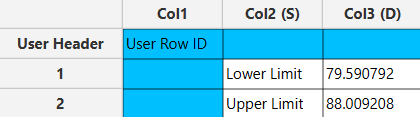
The output data of the calculation is presented in the right-hand spreadsheet of the tab, displaying the Lower Limit and Upper Limit.
Population Proportion
This method illustrates how the confidence interval provides a range of plausible values for the population proportion based on the sample data, factoring in the given level of confidence.
Use the Population Proportion function for calculating confidence intervals by browsing in the top ribbon:
| Statistics \(\rightarrow\) Confidence Intervals \(\rightarrow\) Population Proportion |
Input
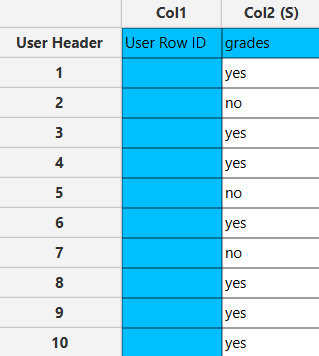
Ensure that the input datasheet contains only one column of data. The data should be of nominal type and are divided into distinct categories that are mutually exclusive. Examples of such categories include “yes” or “no” responses, “male” or “female” categories, “pass” or “fail” outcomes, etc. If integer values are used to represent these categories, such as 1 or 0, it is acceptable.
Configuration
| Confidence level | Manually insert confidence level which may range from 0 to 100. |
| Sample size (n) | Insert the number of data points in the dataset. |
| Possibility (p) | Enter the value that represents the sample proportion. |
Output
The output datasheet presents the Lower Limit and Upper Limit values in separate rows.
Example
Input
The left-hand spreadsheet contains a column that is populated with the necessary data for calculating confidence intervals for a population proportion.
Configuration
- Select
Statistics\(\rightarrow\)Confidence Intervals\(\rightarrow\)Population Proportion. - Type the
Confidence Level[1]. The value will range from 0 to 100. - Type the
Sample Size (n)[2]. - Type the
Possibility (p)[3]. - Click on the
Executebutton [4] to apply the confidence intervals calculation.

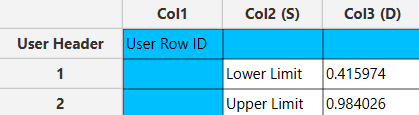
Output
The output data of the calculation is presented in the right-hand spreadsheet of the tab, displaying the Lower Limit and Upper Limit. This interval suggests that we are 95% confident that the true proportion of “yes” responses in the population lies between 41.6% and 98.4%.
References
- Smithson, M., Confidence intervals. 2003: Sage. doi.org/10.4135/9781412983761
- Meeker, W.Q., G.J. Hahn, and L.A. Escobar, Statistical intervals: a guide for practitioners and researchers. Vol. 541. 2017: John Wiley & Sons.
Version History
Introduced in Isalos Analytics Platform v0.2.4
Instructions last updated on July 2024