Normalizers
Data scaling (normalization or standardization) is considered as a standard pre-processing procedure in data science and in machine learning model development. Both techniques aim to force data that have substantially different numerical ranges to acquire comparable values and thus, to facilitate their manipulation and modeling and contribute equally to the analysis.1
Z Score
Linear transformation (standardization) of the data so that each feature is Gaussian-distributed: their normalized values present a mean value equal to 0 and standard deviation equal to 1. The transformation is achieved through Eq. 11.
where ${\widetilde{x}}_i$ and $x_i$ are the standardized and the original values of the $i$th instance of $\mathbf{X}$ feature vector respectively, $\bar{\mathbf{X}}$ is the mean value of $\mathbf{X}$ and, $s$ is the standard deviation of $\mathbf{X}$.
Use the Z Score function by browsing in the top ribbon:
| Data Transformation \(\rightarrow\) Normalizers \(\rightarrow\) Z Score |
Input
Data matrix with arbitrary data requiring standardization.
Configuration
| Include/exclude columns | Select manually the columns that are going to be standardized through the dialog window: Use the buttons to move columns between the Included Columns (subject to standardization) and Excluded Columns list. Single-arrow buttons will move all selected columns and double-arrow buttons will move all columns. Columns with categorical features cannot be selected for standardization. |
Output
Data matrix with standardized data. If categorical features are included in the input table, these are presented intact in the output table.
Example
Input
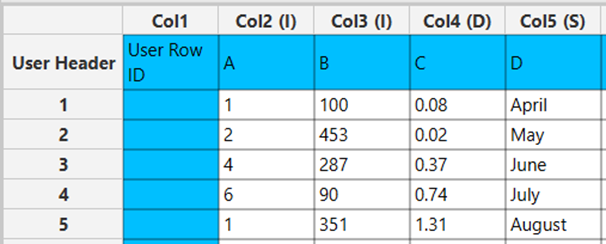
In the left-hand spreadsheet of the tab import the data matrix that is going to be standardized.
Configuration
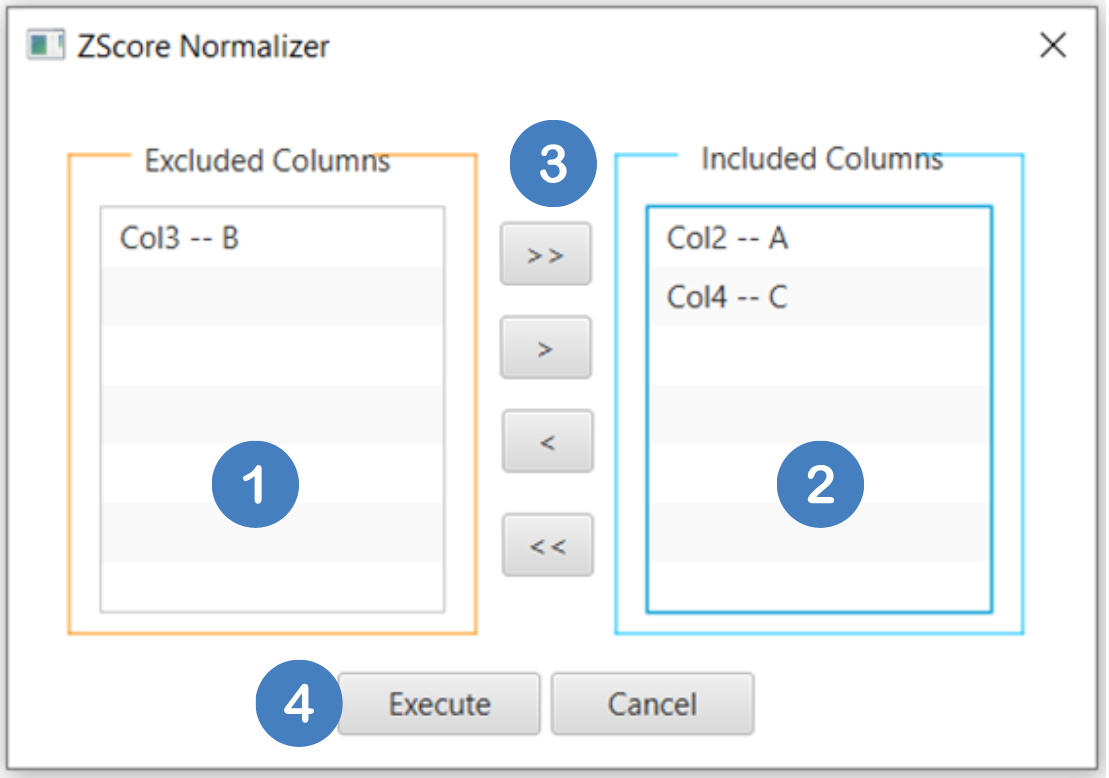
- Select
Data Transformation\(\rightarrow\)Normalizers\(\rightarrow\)Z Score. - Select the columns that are going to be standardized by clicking on the arrow buttons [3] and moving columns between the
Excluded Columns[1] andIncluded Columns[2] lists. The columns containing categorical values are not subject to normalization. In this case only columns “A” and “C” are going to be normalized. - Click on the
Executebutton [4] to apply the standardization on the selected columns.
Output
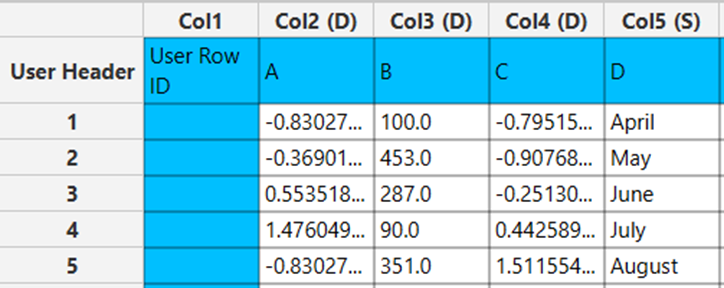
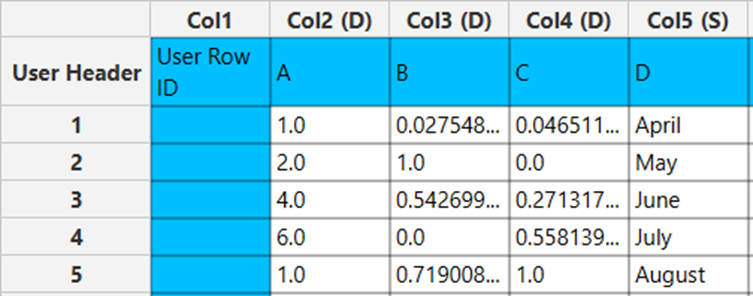
In the right-hand spreadsheet of the tab the output data matrix with the standardized columns “A” and “C” is presented.
Min-Max
Linear transformation (normalization) of the data to lie within a predefined range, usually between [0, 1] or [-1, 1]. Eq. 2 is used to transform the data to fall within the range of [0, 1]. Appropriate alterations to this equation are made for other normalization ranges2.
where ${\widetilde{x}}_i$ is the transformed value of instnce $i$ of the $\mathbf{X}$ feature vector, $x_i$ is the actual value of instance $i$ of $\mathbf{X}$, and the minimum and maximum values for each feature are taken over all instances of the $\mathbf{X}$ feature vector of the input dataset2.
Use the Min-Max function by browsing in the top ribbon:
| Data Transformation \(\rightarrow\) Normalizers \(\rightarrow\) Min-Max |
Input
Data matrix with arbitrary data requiring normalization.
Configuration
| Include/exclude columns | Select manually the columns that are going to be normalized through the dialog window: Use the buttons to move columns between the Included Columns (subject to normalization) and Excluded Columns list. Single-arrow buttons will move all selected columns and double-arrow buttons will move all columns. Columns with categorical features cannot be selected for normalization. |
| Min | The lower bound of the range used for normalization (default value: 0). |
| Max | The upper bound of the range used for normalization (default value: 1). |
Output
Data matrix with normalized data. If categorical features are included in the input table, these are presented intact in the output table.
Example
Input
In the left-hand spreadsheet of the tab import the data matrix that is going to be normalized.
Configuration
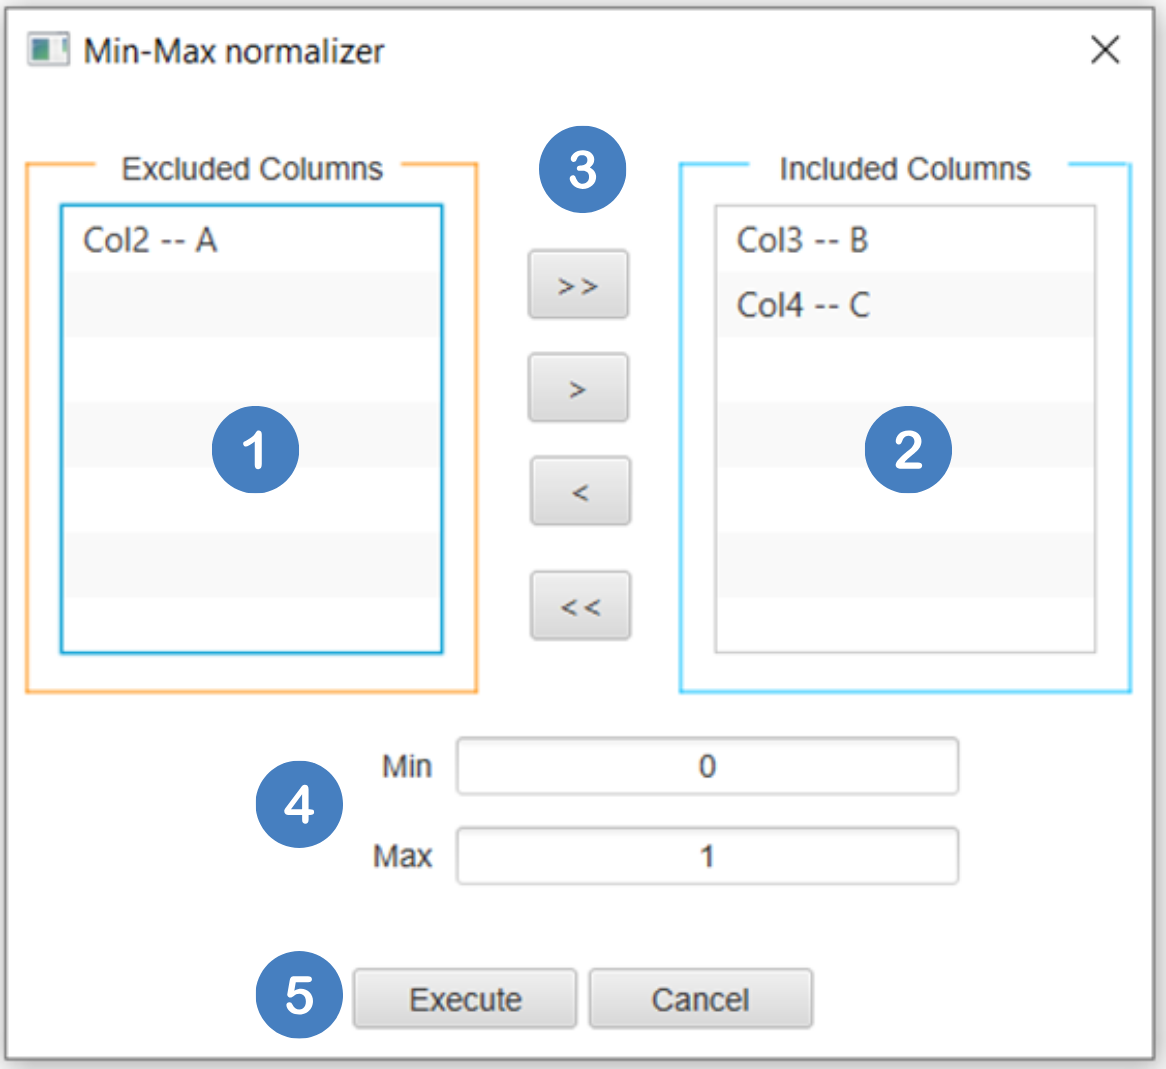
- Select
Data Transformation\(\rightarrow\)Normalizers\(\rightarrow\)Min-Max. - Select the columns that are going to be normalized by clicking on the arrow buttons [3] and moving columns between the
Excluded Columns[1] andIncluded Columns[2] lists. The columns containing categorical values are not subject to normalization. In this case only columns “B” and “C” are going to be normalized. - Select the lower-
Minand upper-Maxlimits [4] for the normalization. - Click on the
Executebutton [5] to apply the normalization on the selected columns.
Output
In the right-hand spreadsheet of the tab the output data matrix with the normalized columns “B” and “C” is presented.
Tips
- It is useful when the feature distribution is normal or Gaussian.
- It is particularly useful when applying algorithms that assume that data are normally distributed, such as linear regression and logistic regression.
- It is less sensitive to outliers, preserving the essential structure of the original data distribution while aligning it to a standardized scale.
- It does not assume any distribution of the data; thus, it is suitable for data that do not follow a Gaussian distribution and when a bounded range is necessary.
- It is useful when applying algorithms that are sensitive to the magnitude of values, such as neural networks and k-nearest neighbors (kNN).
- It is highly sensitive to outliers since the minimum and maximum bounds are affected by extreme values. Therefore, it may alter the shape of data distribution, especially in the presence of significant outliers.
See also
The model generated by either the Z Score or Min-Max function can be applied to any input data through the Existing Model Utilization (e.g., a scaling function tuned from the training set data of a machine learning model can be applied to the test/external set data).
References
- Leach AR, Gillet VJ. An introduction to chemoinformatics. 2007. doi.org/10.1007/978-1-4020-6291-9.
- Witten Ian H and Frank, Eibe and Hall, Mark A and Pal CJ. Data Mining: Practical Machine Learning Tools and Techniques. Fourth. Morgan Kaufmann; 2011. doi.org/10.1016/C2009-0-19715-5.
Version History
Introduced in Isalos Analytics Platform v0.1.18
Instructions last updated on May 2024