Split
The splitting of a dataset is a common pre-processing step in data analysis and modelling, either to reduce the volume of the data or to create subsets that will be used within the model external validation process1. In the latter case, two representative subsets are often required, and for that the initial dataset is divided into training and test sets. Objects within the test set are not used during model development but are left out to measure the performance of the model in real-case scenarios2,3. The splitting can be performed either randomly or using a method of representative selection, so that the selected instances cover uniformly the data space.
Kennard-Stone
The Kennard-Stone method facilitates the selection of two representative subsets (e.g., training and test sets) with a uniform distribution over an initial dataset4. This function implements the approach of Daszykowski et al.1:
- Initially, a central object is selected from the dataset.
- Extreme objects from the data space border are then added to the training set.
Specifically, the method begins by calculating the mean of the dataset. The object closest to this mean, deemed the most representative, is assigned as the first object in the training set (first partition) and subsequently removed from the initial dataset. The second object chosen for the training set is the one furthest from the first and is also removed from the dataset.
Following this, the algorithm continues by iteratively adding objects to the training set. For each iteration, it calculates the Euclidean distance between each remaining unassigned object and the already selected objects. The object furthest from its closest neighbor in the training set is selected and added to the training set. This process repeats until the desired number of samples is included in the training set.
Use the Kennard-Stone function by browsing in the top ribbon:
| Data Transformation \(\rightarrow\) Split \(\rightarrow\) Kennard-Stone |
Input
Data matrix to partition.
Configuration
| Target Column | Select the target column (dependent variable). This will be excluded from the splitting procedure. String columns are automatically excluded. |
| Percentage | An integer number between (0, 100) specifying the splitting ratio, i.e., the proportion of input rows included in the first partition. Default value: 40. |
| Perform Computations | Choose whether to perform calculations on the CPU or the GPU (if available on the user’s PC). The GPU option enables faster computations by leveraging the graphics processing unit. |
Output
Two data partitions. The results are not visible in the output spreadsheet, but the different partitions can be imported independently in other tabs.
Example
Input
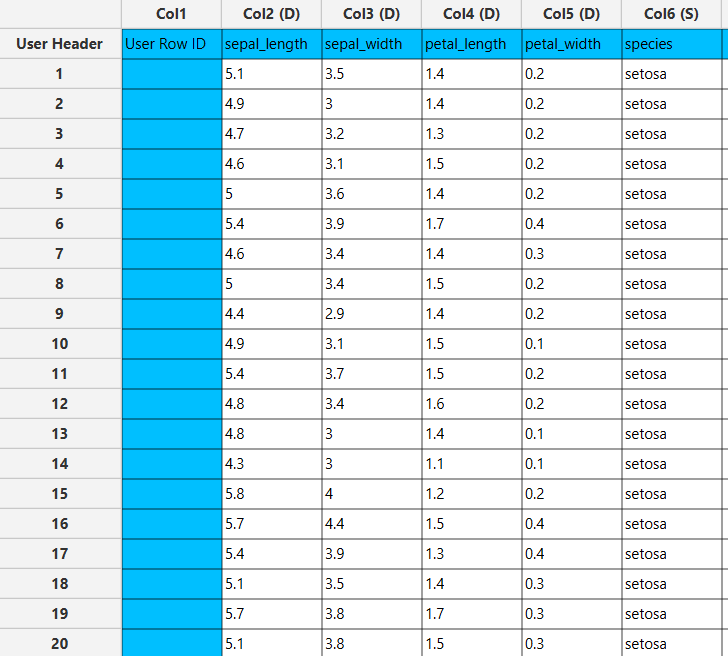
In the left-hand spreadsheet of the tab import the data matrix that is going to be split.
Configuration
- Select
Data Transformation\(\rightarrow\)Split\(\rightarrow\)Kennard-Stone. - Select the
Target Columnname from the dropdown list [1]. - Type in the
Percentagefield [2] the ratio of input rows included in the first partition. - Select whether the calculations are performed on CPU or GPU [3].
- Click on the
Executebutton [4] to perform the data partitioning.

Output
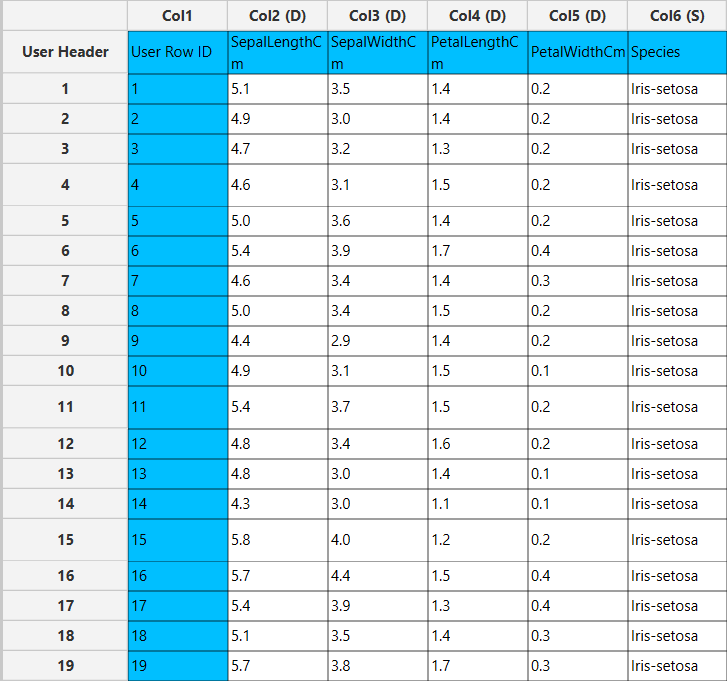
- In the right-hand spreadsheet of the tab the input data matrix is presented intact.
- Insert a new tab by clicking on the
+button [1]. - Right click on the left-hand spreadsheet and select
Import from SpreadSheet[2]. - In the configuration window select from the
Select input tabthe training (first partition) or the test set (second partition) [3]. - Click on the
Executebutton [4] and continue with the rest of your analysis steps.

Random Partitioning
Random row-wise split of the input data matrix in two subsets (e.g., training and test sets).
Use the Random Partitioning function by browsing in the top ribbon:
| Data Transformation \(\rightarrow\) Split \(\rightarrow\) Random Partitioning |
Input
Data matrix to partition.
Configuration
| Training set percentage | An integer number between (0, 100) specifying the splitting ratio, i.e., the proportion of input rows included in the first partition. Default value: 40. |
| Usage of random generator seed | Specify an integer number as fixed seed to acquire reproducible results in case of re-execution of the splitting step. If you tick on the Usage of random generator seed checkbox, different splits will be produced upon re-execution. |
| Stratified sampling | Check this box, then select the column name from the dropdown list to ensure that the distribution of its values is approximately preserved during partitioning. |
Output
Two data partitions. The results are not visible in the output spreadsheet, but the different partitions can be imported independently in other tabs.
Example
Input
In the left-hand spreadsheet of the tab import the data matrix that is going to be split.
Configuration
- Select
Data Transformation\(\rightarrow\)Split\(\rightarrow\)Random Partitioning. - Type the
Training set percentage[1] and the fixed seed [2] to achieve reproducible splits. Otherwise, click on theUsage of random seed generator[3]. - (Optional) Click on the
Stratified samplingcheckbox [4] and select the column name [5] that corresponds to the feature whose values distribution will be preserved in both partitions. - Click on the
Executebutton [6] to perform the data partitioning.

Output
- In the right-hand spreadsheet of the tab the input data matrix is presented intact.
- Insert a new tab by clicking on the
+button [1]. - Right click on the left-hand spreadsheet and select
Import from SpreadSheet[2]. - In the configuration window select from the
Select input tabthe training (first partition) or the test set (second partition) [3]. - Click on the
Executebutton [4] and continue with the rest of your analysis steps.
k-Fold Partitioning
K-fold partitioning is the process of dividing a dataset into k approximately equal subsets, or folds, in order to organize the data systematically before model development and evaluation. In this approach, one fold can be designated as the test set, while the remaining folds are retained for model training or other analytical purposes. The main rationale for using this procedure is that it provides a more structured and balanced way of splitting the data than relying on a single arbitrary partition. As a result, it helps reduce the risk that the findings will be overly influenced by a fortunate or unrepresentative split of the sample. More broadly, k-fold partitioning supports a more transparent, stable, and representative organization of the data, which is especially valuable when the available dataset is limited in size.
Use the K-fold Partitioning function by browsing in the top ribbon:
| Data Transformation \(\rightarrow\) Split \(\rightarrow\) k-Fold Partitioning |
Input
Data matrix to partition.
Configuration
| k | Specifies the number of folds into which the dataset is divided, determining how many subsets are created during the partitioning process. |
| Time-based RNG Seed | Sets the random number generator seed based on the current time, producing a different random partition each time the procedure is run. |
| Stratified sampling | Check this box, then select the column name from the dropdown list to ensure that the distribution of its values is approximately preserved during partitioning. |
| Leave One Out | Creates partitions in which each observation is left out once as the test set, while all remaining observations are used for training. |
Output
k data partitions. The results are not visible in the output spreadsheet, but the different partitions can be imported independently in other tabs.
Example
Input
In the left-hand spreadsheet of the tab import the data matrix that is going to be split.
Configuration
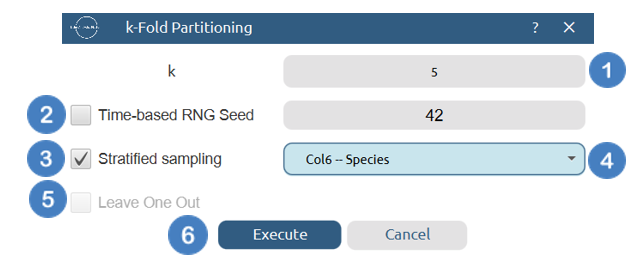
- Select
Data Transformation\(\rightarrow\)Split\(\rightarrow\)k-Fold Partitioning. - Specify the number of folds,
k, [1] for the data partitioning. - Specify the fixed seed [2] to obtain reproducible partitions. Otherwise, select the
Time-based RNG Seed[3]. - (Optional) Click on the
Stratified samplingcheckbox [3] and select the column name [4] that corresponds to the feature whose values distribution will be preserved in both partitions. - (Optional) Click on the
Leave One Outcheckbox [5] to create partitions in which each observation is used once as the test set. - Click on the
Executebutton [6] to perform the k-fold partitioning.
Output
- In the right-hand spreadsheet of the tab the input data matrix is presented intact.
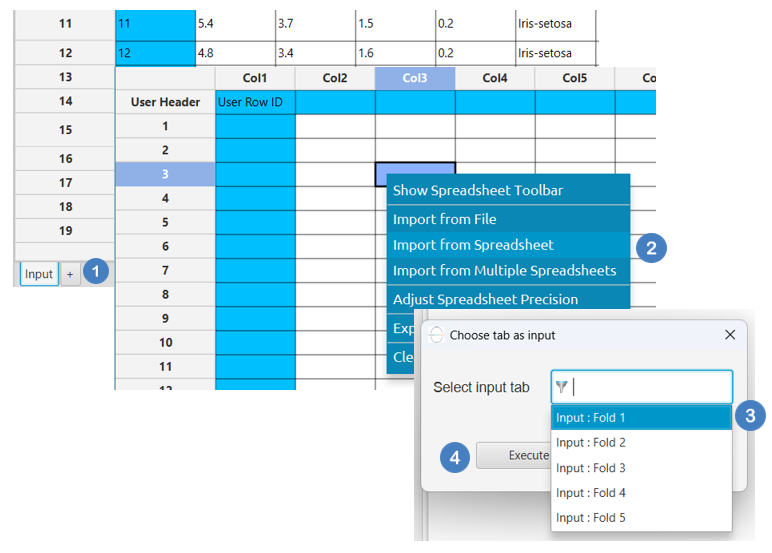
- Insert a new tab by clicking on the
+button [1]. - Right click on the left-hand spreadsheet and select
Import from SpreadSheet[2]. - In the configuration window, select from the
Select input tabthe four folds [3] that will constitute the training set, and then select the remaining fold to serve as the test set. - Click on the
Executebutton [4] and continue with the rest of your analysis steps.
✧ Tips
- The splitting functions are useful when two (or more) subsets of data are needed, e.g., as training and test/validation sets in model development or when the original dataset is too large to process in its entirety, allowing for analysis to be conducted on a more manageable subset.
- The Kennard and Stone methodology, in contrast to random partitioning, is a deterministic methodology, producing consistent partitions for given input parameters and data matrices. It also allows more representative subset selection that covers all the data space. However, it is more time-consuming compared to random partitioning for the same input data matrix and splitting ratio.
- Consider data scaling – if necessary – prior to the use of the Kennard-Stone function, as calculation of distances is performed.
- External validation using Kennard-Stone splitting is advised to be supplemented by cross-validation and/or other validation methodologies, as it is possible that the results lead to an overestimation of the models’ predictive ability (test set too similar to the training set).
See also
The generated train and test sets from the splitting function can be imported to subsequent tabs/nodes (see Data Representation). For data scaling refer to the Normalizers functions.
References
- Daszykowski M, Walczak B, Massart DL. Representative subset selection. Anal Chim Acta 2002. doi.org/10.1016/S0003-2670(02)00651-7.
- Witten Ian H and Frank, Eibe and Hall, Mark A and Pal CJ. Data Mining: Practical Machine Learning Tools and Techniques. Fourth. Morgan Kaufmann; 2011. doi.org/10.1016/C2009-0-19715-5.
- Varsou D-D, Kolokathis PD, Antoniou M, Sidiropoulos NK, Tsoumanis A, Papadiamantis AG, et al. In silico assessment of nanoparticle toxicity powered by the Enalos Cloud Platform: Integrating automated machine learning and synthetic data for enhanced nanosafety evaluation. Comput Struct Biotechnol J 2024;25:47–60. doi.org/10.1016/j.csbj.2024.03.020.
- Kennard RW, Stone LA. Computer aided design of experiments 1969;11:137–48. doi.org/10.2307/1266770.
Version History
Introduced in Isalos Analytics Platform v0.2.3
Instructions last updated on June 2024