Applicability Domain - APD
The main goal of models’ development and machine learning applications is the possibility of facilitating strategic decisions by providing reliable predictions. However, stakeholders need to build a level of confidence towards the produced predictions to employ it in real-life applications. Therefore, every theoretical model should be accepted in practical use via the definition of an area of accepted (reliable) predictions. This can be achieved by defining the applicability domain of the model, for example, by comparing the relative “position” of the test instances to the space limits framed by the training instances.1
In the Domain – APD function the Euclidean distance method is included: The distance of each test instance to each nearest neighbour of the training set instances is compared to a predefined threshold (see Eq. 1); if this distance is lower than the threshold then it falls within the applicability domain limits of the model and its dependent/response variable (endpoint) prediction can be considered reliable.2 The threshold value depends only on the training instances and is calculated independently of the developed model.
Initially, all Euclidean distances between all training instances are calculated, as well as the mean value of these distances (\(D_{av}\)). In a next step the new average value \(\langle d \rangle\) and standard deviation \(\sigma\) of the distances included in the subset of training instances, which have lower distance than \(D_{av}\), are calculated. \(\mathrm{Z}\), is an empirical cut-off value, the default value is equal to 0.5.
Use the Domain – APD function by browsing in the top ribbon:
| Statistics \(\rightarrow\) Applicability Domain \(\rightarrow\) APD |
Input
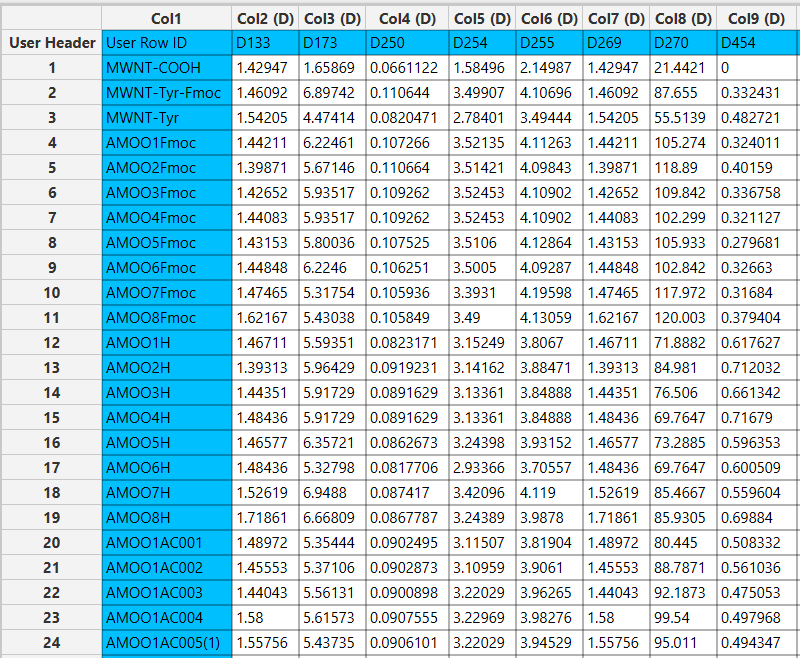
Data matrix with arbitrary data. String columns are not taken into account in the calculation of the applicability domain threshold.
Configuration
| Z | Τhe \(\mathrm{Z}\) value (default value 0.5). |
| Perform Computations | Select whether the calculations are running on CPU or GPU (this option is automatically enabled, when a GPU is detected in the user’s computer). |
Output
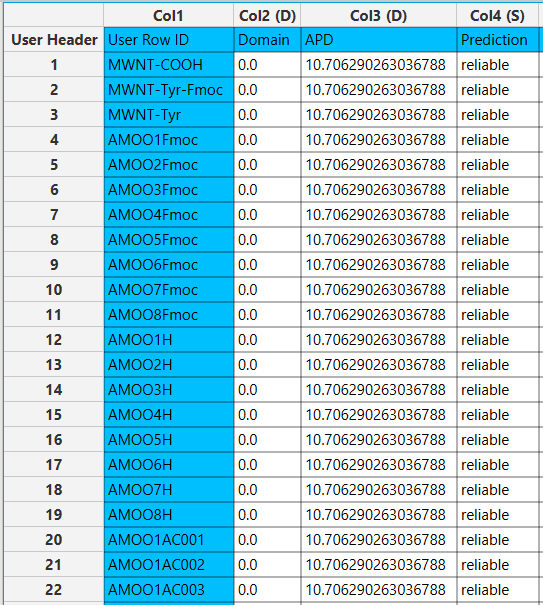
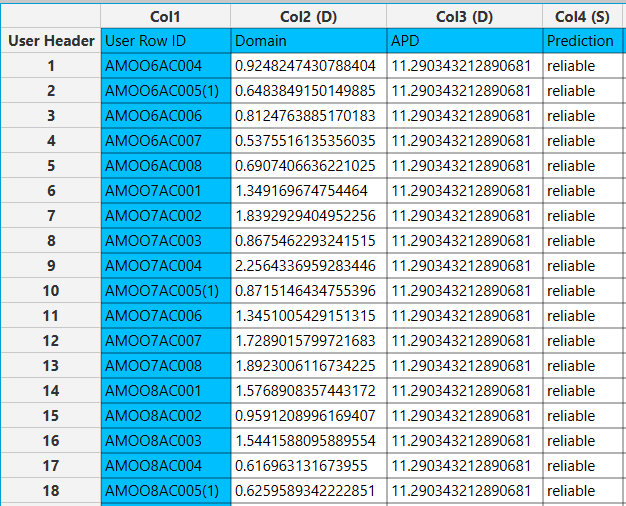
A data matrix including the calculated distance (Domain) to the nearest instance of the training set for each row, the calculated applicability domain threshold (APD), and the prediction status (Prediction). The Prediction indicates whether the instance is reliable or unreliable, based on whether it falls within the applicability domain limits.
Example
Input
In the left-hand spreadsheet of the tab insert the training set data. In case that categorical-string columns are included in the set, these are not taken into account for the calculation of the applicability domain limits. Remove also the response variable column (if included in the set).
Configuration
- Select
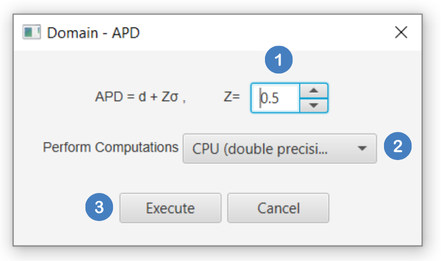
Statistics\(\rightarrow\)Applicability Domain\(\rightarrow\)APD. - Define the
Zvalue [1]. - Select from the
Perform Computationsdropdown list whether calculations are performed on CPU or on GPU [2]. - Click on the
Executebutton [3] to calculate the applicability domain limits.
Output
In the right-hand spreadsheet of the tab the output data matrix with the Domain, APD, and Prediction columns are presented.
Application on an external set
You can apply the generated Domain – APD model to any external data using the Existing Model Utilization function:
- Impοrt the external data in the left-hand spreadsheet of the tab. Include the same columns used to build the applicability domain model.
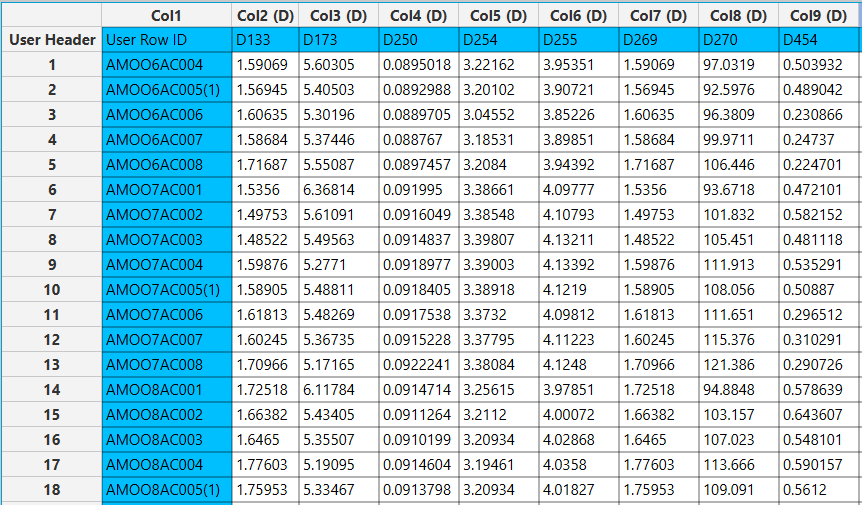
- Select
Analytics\(\rightarrow\)Existing Model Utilization. Select theDomain – APDmodel [1] and click on theExecutebutton [2].
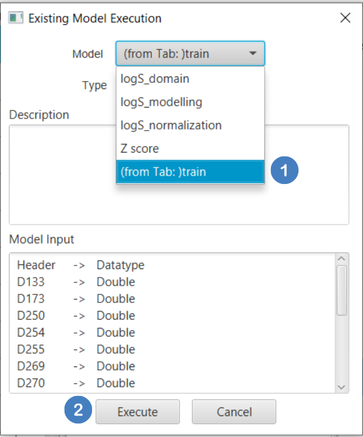
- Inspect the results in the right-hand spreadsheet of the tab.
✧ Tips
- As calculations of Euclidean distances are performed, consider scaling the data beforehand using a Normalizer function.
See also
The model generated by the Domain – APD function can be applied to any input data through the Existing Model Utilization function (e.g., to check if a test/external set of data falls within the applicability domain limits of a machine learning model, see Example).
References
- Gadaleta D, Mangiatordi GF, Catto M, Carotti A, Nicolotti O. Applicability Domain for QSAR Models: Where Theory Meets Reality. Int J Quant Struct Relationships 2016;1:45–63. doi.org/10.4018/IJQSPR.2016010102.
- Zhang S, Golbraikh A, Oloff S, Kohn H, Tropsha A. A Novel Automated Lazy Learning QSAR (ALL-QSAR) Approach: Method Development, Applications, and Virtual Screening of Chemical Databases Using Validated ALL-QSAR Models. J Chem Inf Model 2006;46:1984–95. doi.org/10.1021/ci060132x.
Version History
Introduced in Isalos Analytics Platform v0.1.18
Instructions last updated on May 2024