Weight Cases
The term “weight cases” in statistics typically refers to the practice of assigning a weight to each case (or a data point) in a dataset to adjust for its importance or representativeness. In some data samples, certain groups may be over-represented or under-represented relative to their actual prevalence in the population data. Weights are used to correct these imbalances, ensuring that the results more accurately reflect the total population. Properly weighted data can provide more accurate and generalizable estimates that reflect the population from which the sample data was drawn. However, applying weights also typically increases the standard error of estimates, reflecting the added uncertainty from the weighting process1. Weighting is particularly critical in complex survey designs and is widely implemented in fields ranging from public health to market research to correct for sampling and non-sampling errors1.
Use the Weight Cases function by browsing in the top ribbon:
| Statistics \(\rightarrow\) Weight Cases |
Table of contents
Input
The input data required for weight cases calculation consists of integers or real values. It does not typically handle categorical or textual data directly without converting those into numerical values first, since the calculations require quantifiable inputs.
Configuration
| Include/exclude columns | Select the columns manually from the available options within the dialog window to perform weight cases calculation: Use the buttons to move columns between the Included Columns and Excluded Columns list. Single-arrow buttons will move all selected columns and double-arrow buttons will move all columns. Columns with categorical features cannot be selected for weight cases calculation. |
Output
The output displays the frequency and percentage distribution of values for each column in your input dataset. It lists distinct values in each column along with their count (instances) and proportion of the total (% instances), providing a concise summary of the data’s distribution across these variables.
Example
Input
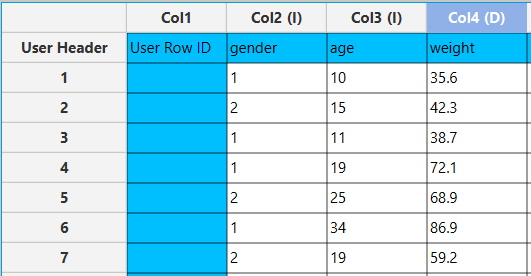
In the left-hand spreadsheet, insert the data for each variable you plan to use for weight cases calculations. In this example, this includes entering the values for gender as integers, age and weight directly into their respective columns. Each row should represent a single data point, ensuring the dataset is structured correctly for further analysis and weight calculation.
Configuration
- Select
Statistics\(\rightarrow\)Weight Cases. - Select the columns that are going to be used for weight cases calculation by clicking on the arrow buttons [3] and moving columns between the
Excluded Columns[1] andIncluded Columns[2] lists. In this case the calculations are performed only for the columns 3-“age” and 4-“weight”. - Click on the
Executebutton [4] to apply the weight cases calculation on the selected columns.

Output
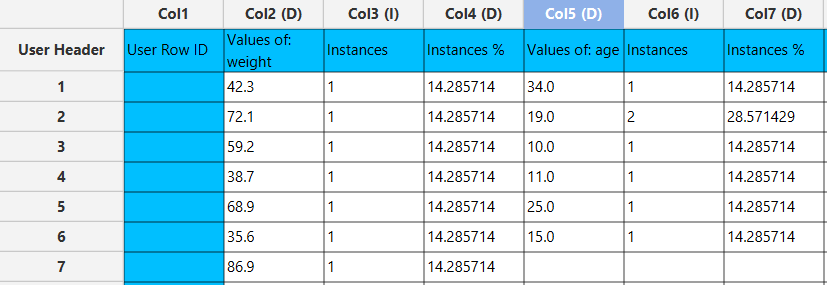
In the right-hand spreadsheet of the tab the output data displays the count (instances) and percentage of the total occurrences (instances %) for each unique value for the selected columns.
References
- Valliant, R. and J.A. Dever, Survey weights: a step-by-step guide to calculation. Vol. 1. 2018: Stata Press College Station, TX.
Version History
Introduced in Isalos Analytics Platform v0.2.4
Instructions last updated on June 2024