Response Surface
Response Surface Designs are a subset of Design of Experiments (DoE) aimed at optimizing a response variable by exploring the relationships between multiple factors and their interactions. These designs are used when the goal is to find the optimal settings for factors that lead to the best outcome, and they are usually used as a next step after performing a screening design to reduce the number of parameters included in the model. By fitting a mathematical model to experimental data, response surface designs allow researchers to map out a surface that represents the response’s behavior across factor levels.
Table of contents
Box Behnken
Box-Behnken1 designs are an integral component of response surface methodology (RSM) in experimental statistics, tailored for optimizing systems with multiple interacting variables. Renowned for their efficiency, these designs effectively capture interactions among variables while avoiding some of the complexities and potential pitfalls of full factorial designs.
A defining feature of Box-Behnken designs is the assignment of each factor to one of three equally spaced values: typically coded as -1, 0, and +1. These values correspond to the low, medium, and high levels for each factor, respectively. Such systematic placement of factors facilitates a comprehensive exploration of the response surface by allowing for a detailed investigation into how different factor levels influence the outcome.
Crucially, Box-Behnken designs are structured to fit a quadratic model. This capability is particularly valuable because it accommodates not only linear relationships but also the interaction effects (products of two factors) and squared terms of the factors. This adaptability makes Box-Behnken designs suitable for experiments where complex interactions between factors are anticipated, and where the response to changes in factor levels may be non-linear.
Another significant advantage of Box-Behnken designs is their ability to maintain a reasonable ratio of experimental points to coefficients in the quadratic model, typically ranging from 1.5 to 2.6. This balance is crucial for managing both computational complexity and the predictive accuracy of the model. By optimizing this ratio, the design maximizes the information obtained from each experimental run, enhancing the efficiency of the study.
Furthermore, Box-Behnken designs aim to minimize the variation in estimation variance, which depends solely on the distance from the center of the design space. This characteristic is particularly evident in designs with four and seven factors, where it helps ensure the reliability of results and maintains low variance across the smallest (hyper)cube encompassing all experimental points.
In summary, Box-Behnken designs offer an optimal trade-off between the completeness of information gathered and the experimental effort required. This makes them a sophisticated yet practical choice for exploring and understanding complex experimental landscapes, especially in scenarios where multiple variables interact in potentially nonlinear ways.
Use the Box Behnken function by browsing in the top ribbon:
| DOE \(\rightarrow\) Response Surface \(\rightarrow\) Box Behnken |
Input
In the input data sheet, numerical values should be specified with minimum 3 columns and two values each representing min and max level of each factor (column). The Box Behnken method is applicable for the following number of selected factors : 3-7,9,10.
Configuration
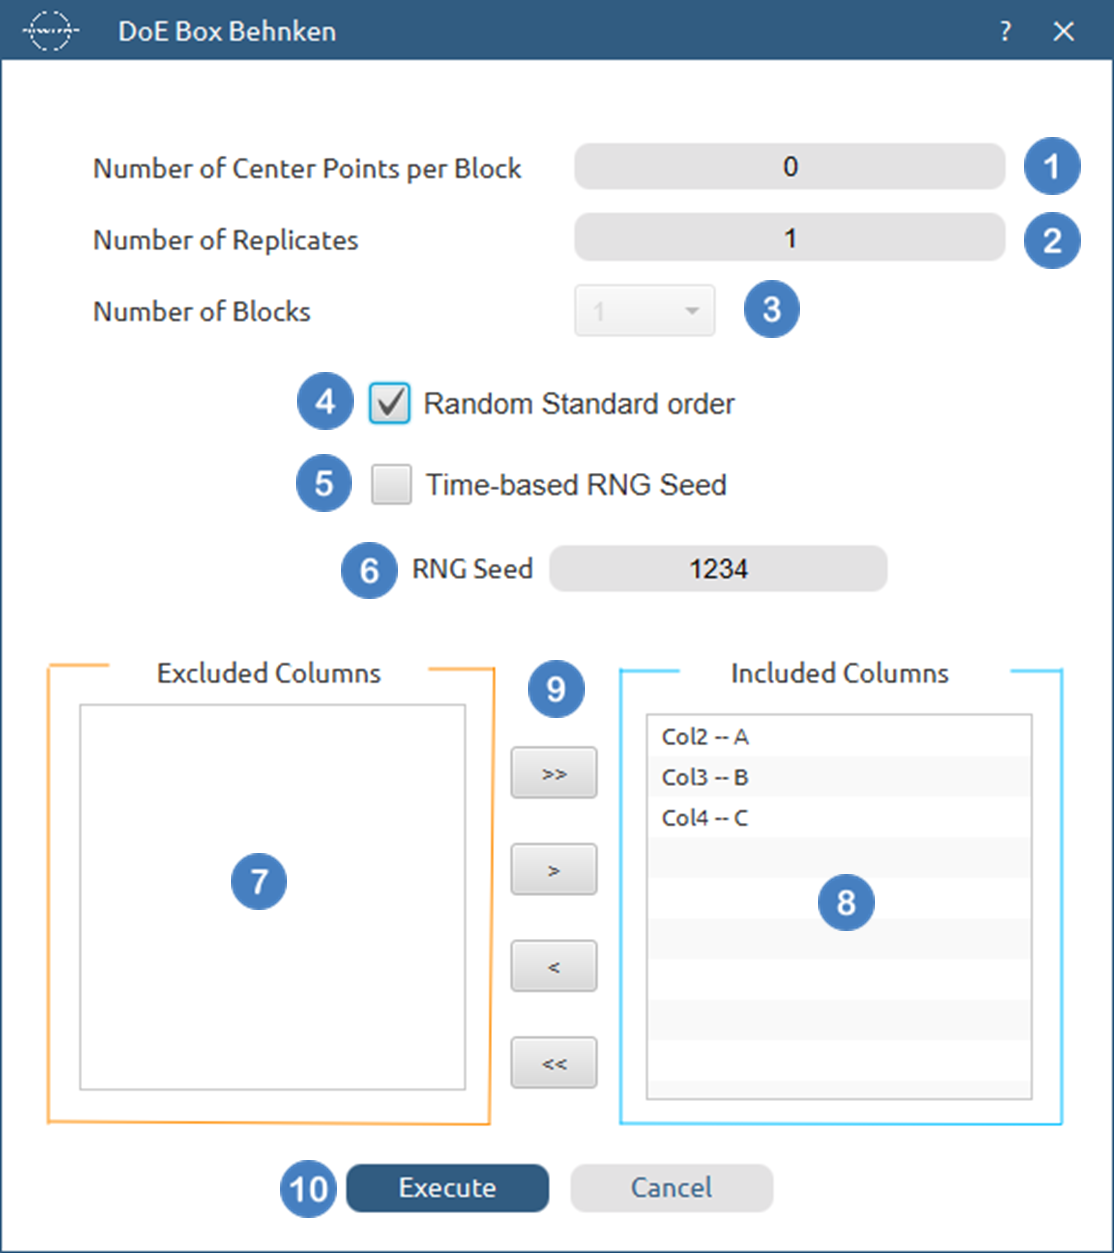
| Number of Center Points per Block | Select manually the Number of Center Points to be included in the output list of experiments. There is no minimum requirement or any other limitation. |
| Number of Replicates | Select manually the Number of Replicates which represents the number of times to replicate the entire design. This value should be an integer, and the lowest acceptable value is 1. |
| Number of Blocks | Select from the list of available options the Number of Blocks. Available options depend on the selected number of factors and the specified number of replicates. |
| Random Standard order | You can tick/select the box if randomness is required in the output list of experiments. |
| Time-based RNG Seed | If in the randomness is selected, then you have the option to also tick/select the box to set the random generated number seed based on time. |
| RNG Seed | Select manually the random generated number seed if required. |
| Include/exclude columns | Select manually the columns through the dialog window: Use the buttons to move columns between the Included Columns and Excluded Columns list. Single-arrow buttons will move all selected columns and double-arrow buttons will move all columns. |
Output
A list of experiments (combinations) is generated in the output datasheet along with the Block number, the Replicate Number, the Standard order and the Point type of each experiment based on the Box Behnken design method.
Example
Input
In the input datasheet in the right-hand side, you can specify minimum of three factors (columns) and minimum two levels/values (rows) for each factors representing min and max values, as shown below.

Configuration
- Select
DOE\(\rightarrow\)Response Surface\(\rightarrow\)Box Behnken. - Select the columns by clicking on the arrow buttons [3] and moving columns between the
Excluded Columns[1] andIncluded Columns[2] lists. - Type the
Number of Center Points per Block[4] to be generated in the output list of experiments. - Select the
Number of Replicates[5]. The lowest value that can be set is 1. - Select the
Number of Blocks[6]. - Select/tick if required the
Random Standard order[7] to imply randomness in the output list of experiments. - If randomness is selected either select/tick to generate the number seed for randomness based on time [8] or by manually setting a value [9].
- Click on the
Executebutton [10] to perform Box Behnken design method.

Output
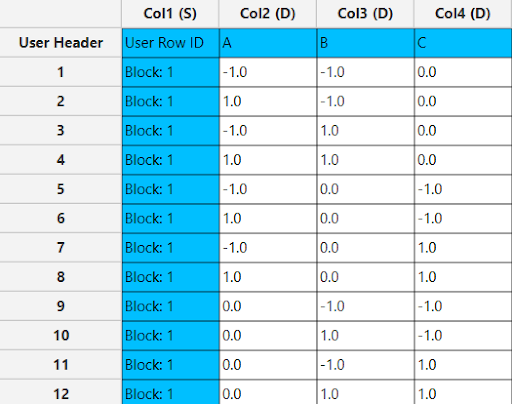
TThe output list of experiments is generated for the three factors outlining a list of 12 experiments based on the Box Behnken design. Standard Order, Block number, Replicate Number and Point Type are presented in Cols 2,3,4 and 5 accordingly as shown below.

Central Composite
The Central Composite Design (CCD), introduced by George E. P. Box and K. B. Wilson in 1951 and followed up by Box and Hunder in 1957,2 is a foundational technique in Response Surface Methodology (RSM) designed to explore the entire response surface of a process and locate the optimal response within that surface. The structure of CCD includes a factorial or fractional factorial design, augmented with center points and a set of “star points”. These star points are strategically placed along the axes of the factors under investigation at a distance that extends beyond the factorial points, crucial for estimating the curvature of the response surface. This design is adept at fitting a full quadratic model, capturing both the interactions between factors and their squared effects.
CCD is divided into two primary variations, each tailored to meet specific experimental needs and constraints:
- Circumscribed Designs : This variant situates cube points at the corners of a unit cube defined by the product of intervals [-1,1]. It includes star points that may lie on or extend outside the cube and center points at the origin. The CCC is advantageous for its ability to explore beyond the confines defined by the factorial points, making it suitable for experiments where extending the range of factor levels is possible.
- Inscribed Designs: In this design, the star points are scaled to the values of -1 and +1, placing them on the surface of the unit cube, while the cube points are located within the interior of the cube. The CCI is particularly beneficial when there are restrictions on the maximum or minimum factor levels that can be practically or safely tested, as it confines the experimentation within the standard levels.
Each of these designs is tailored to fit different experimental conditions and requirements, allowing researchers to choose based on the number of factors, the limitations on factor levels, the necessity to explore beyond the factorial space, and the resources available for conducting experiments. By providing a range of configurations, CCDs offer a flexible and robust framework for experimenters aiming to optimize processes and responses effectively.
For each design, the distance of each star point from the center point of the design—denoted as α (alpha)—must be calculated. Isalos offers four different calculation options for determining α:
- Rotatable : This option sets α such that the design is rotatable, meaning the prediction variance of the response is constant at all points equidistant from the center. Rotatable designs are often preferred for their balanced precision across the experimental space.
- Orthogonal: In this configuration, α is chosen to make the design orthogonal, ensuring that the estimates of the linear and quadratic effects are uncorrelated. Orthogonal designs are advantageous when minimizing confounding between model terms is a priority.
- Face Centered : This approach positions the star points directly on the faces of the cube rather than beyond its surface. Consequently, each factor is evaluated at only three levels instead of the five used in the other design options. Face-centered designs are useful when experimental resources are limited or when physical or operational constraints prevent exploring the full range of factor levels.
- User Defined: This option allows the user to specify a custom value for α. It provides full flexibility for tailoring the design to specific experimental needs, such as aligning with prior studies, physical limitations, or desired precision within a particular region of interest.
Use the Central Composite function by browsing in the top ribbon:
| DOE \(\rightarrow\) Response Surface \(\rightarrow\) Central Composite |
Input
Numerical values should be specified in the input datasheet. The minimum requirement is to specify 2 columns (factors) along with two levels (values/rows) each representing min and max levels, respectively.
Configuration
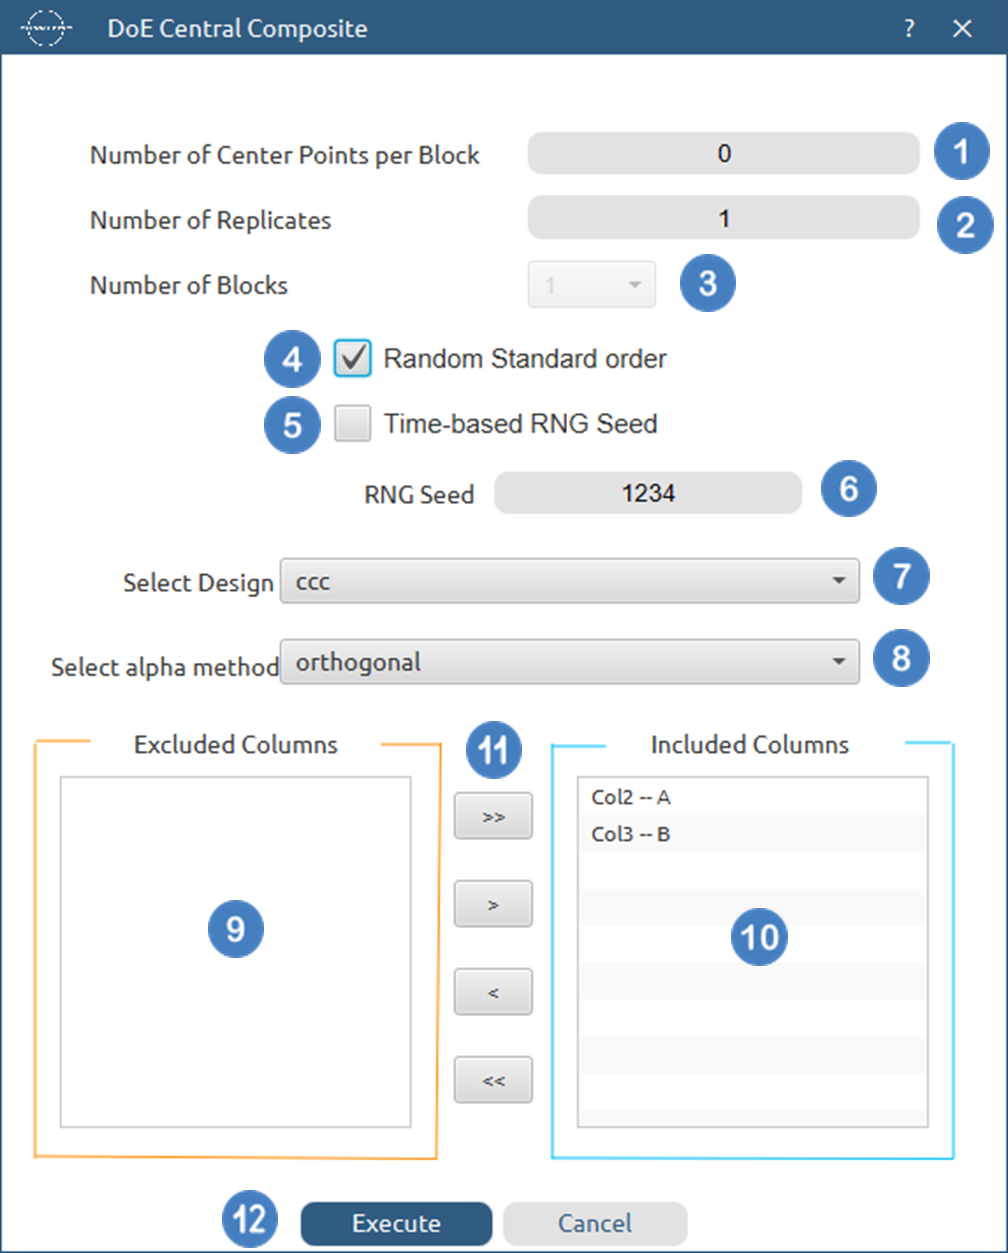
| Factorial Fraction | Select the Factorial Fraction to be used for the factorial portion of the design. The available options automatically adjust based on the number of factors selected. |
| Number of Replicates | Select manually the Number of Replicates which represents the number of times to replicate the entire design. This value should be an integer, and the lowest acceptable value is 1. |
| Number of Blocks | Select from the list of available options the Number of Blocks. Available options depend on the selected number of factors, the selected factorial fraction and the number of replicates. |
| Use Default Number of Center Points | You can tick/select the box if you want to use the default number of center points that produce orthogonal designs, when possible. |
| Number of Center Points per Cube Block | This option refers to the number of center points that will be added in each block that contains cube/factorial runs. If the Use Default Number of Center Points option is not selected, insert manually the Number of Center Points per Cube Block to be included in the output list of experiments. There is no minimum requirement or any other limitation. |
| Number of Center Points per Axial Block | This option refers to the number of center points that will be added in each block that contains axial/star runs. If the Use Default Number of Center Points option is not selected, insert manually the Number of Center Points per Axial Block to be included in the output list of experiments. There is no minimum requirement or any other limitation. |
| Random Standard order | You can tick/select the box if randomness is required in the output list of experiments. |
| Time-based RNG Seed | If in the randomness is selected, then you have the option to also tick/select the box to set the random generated number seed based on time. |
| RNG Seed | Select manually the random generated number seed if required. |
| Select Central Composite Design | Choose among the options, Circumscribed, Inscribed. |
| Select alpha method | Select the method that will be used to compute the alpha parameter. Available options include: Rotatable, Orthogonal, Face Centered (Not available when the inscribed option is selected) and User Defined |
| Value of alpha | If the User Defined alpha method is selected insert manually the value of alpha. |
| Include/exclude columns | Select manually the columns through the dialog window: Use the buttons to move columns between the Included Columns and Excluded Columns list. Single-arrow buttons will move all selected columns and double-arrow buttons will move all columns. |
Output
A list of experiments (combinations) is generated in the datasheet along with the Block number, the Replicate Number, the Standard order and the Point type of each experiment based on the Central Composite design method selected.
Example
Input
In the input datasheet minimum requirement is to specify three factors (columns) and insert minimum two levels (values) for each factor (column), as shown below..

Configuration
- Select
DOE\(\rightarrow\)Response Surface\(\rightarrow\)Central Composite. - Select the columns by clicking on the arrow buttons [3] and moving columns between the
Excluded Columns[1] andIncluded Columns[2] lists. - Select the
Factorial Fraction[4] from the list of available options. - Select the
Number of Replicates[5]. The lowest value that can be set is 1. - Select the
Number of Blocks[6]. - Select whether to
Use Default Number of Center Points.[7] - If the Default Number of Center Points is not selected Select the
Number of Center Points per Cube Block[8] and theNumber of Center Points per Axial Block[9] to be generated in the output list of experiments. - Select/tick if required the
Random Standard order[10] to imply randomness in the output list of experiments. - If randomness is selected either select/tick to generate the number seed for randomness based on time [11]] or by manually setting a value [12].
- Choose to
Select Central Composite Design[13] method among the options,Circumscribed,Inscribed. Select alpha method[14] among the options :Orthogonal,Rotatable,Face CenteredandUser Defined.- If the
User Definedalpha method is selected, specify theValue of alpha[15]. - Click on the
Executebutton [16] to apply the Central Composite design method.

Output
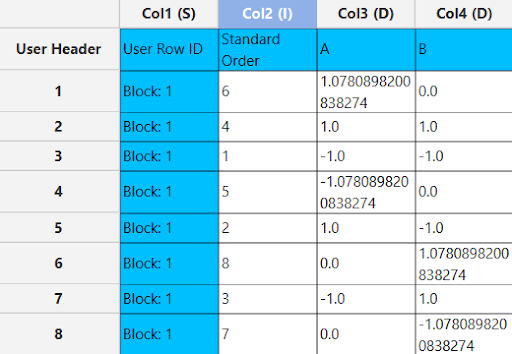
The output list of experiments is generated for the two factors outlining a list of 8 experiments based on the Central Composite Circumscribed (ccc) and orthogonal design. Standard Order, Block number, Replicate Number and Point Type are presented in Cols 2,3,4 and 5 accordingly as shown below.

References
-
Box, G.E. and Behnken, D.W., Some new three level designs for the study of quantitative variables. Technometrics, 1960. 2(4): p. 455-475. doi.org/10.1080/00401706.1960.10489912.
-
Box, G.E. and Wilson, K.B., On the experimental attainment of optimum conditions, in Breakthroughs in statistics: methodology and distribution. 1992, Springer. p. 270-310. doi.org/10.1007/978-1-4612-4380-9_23.
-
Montgomery, Douglas C. Design and analysis of experiments. John wiley & sons, 2017.
-
Speed, Terry. Statistics for Experimenters: Design, Innovation, and Discovery. 2006.
-
Wu, CF Jeff, and Michael S. Hamada. Experiments: planning, analysis, and optimization. John Wiley & Sons, 2011.
Version History
Introduced in Isalos Analytics Platform v0.2.4
Instructions last updated on November 2025