Business Intelligence
Business Ιntelligence is about turning raw data into clear, meaningful insights. It helps reveal patterns, highlight trends, and support more confident, data‑driven decisions.
The Business intelligence menu provides a dedicated space for building a customizable dashboard. It enables the inclusion of labels and all available charts. These elements can be freely resized and repositioned throughout the dashboard.
Create Dashboard
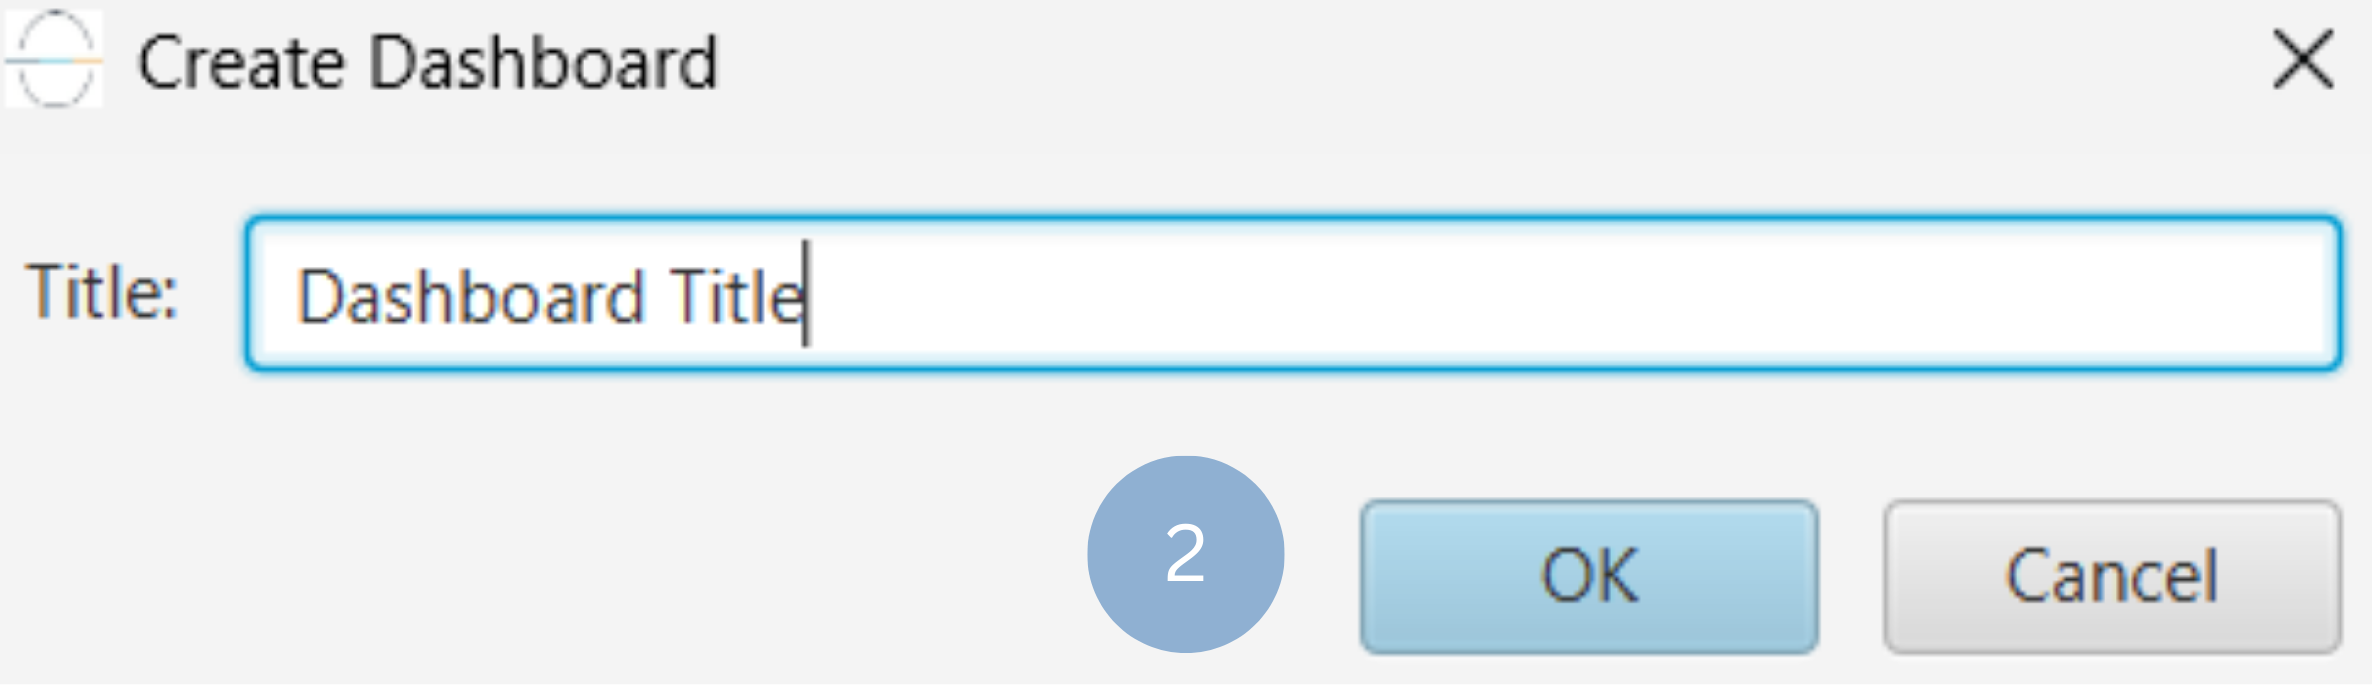
Use the Create New Dashboard (1) function by browsing in the top ribbon:
| Business Intelligence \(\rightarrow\) Create New Dashboard |

To Name the dashboard change the text in the pop up window (2).
Add Plot
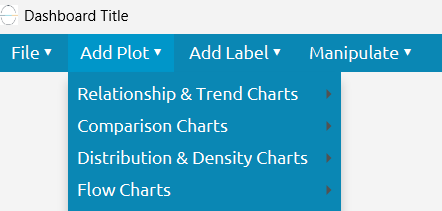
To add an Isalos plot to the dashboard, select Add Plot and choose the desired chart. The configuration window will open, allowing you to configure the plot as described in the corresponding plot sections. The plot can be moved and resized like any other element on the dashboard.
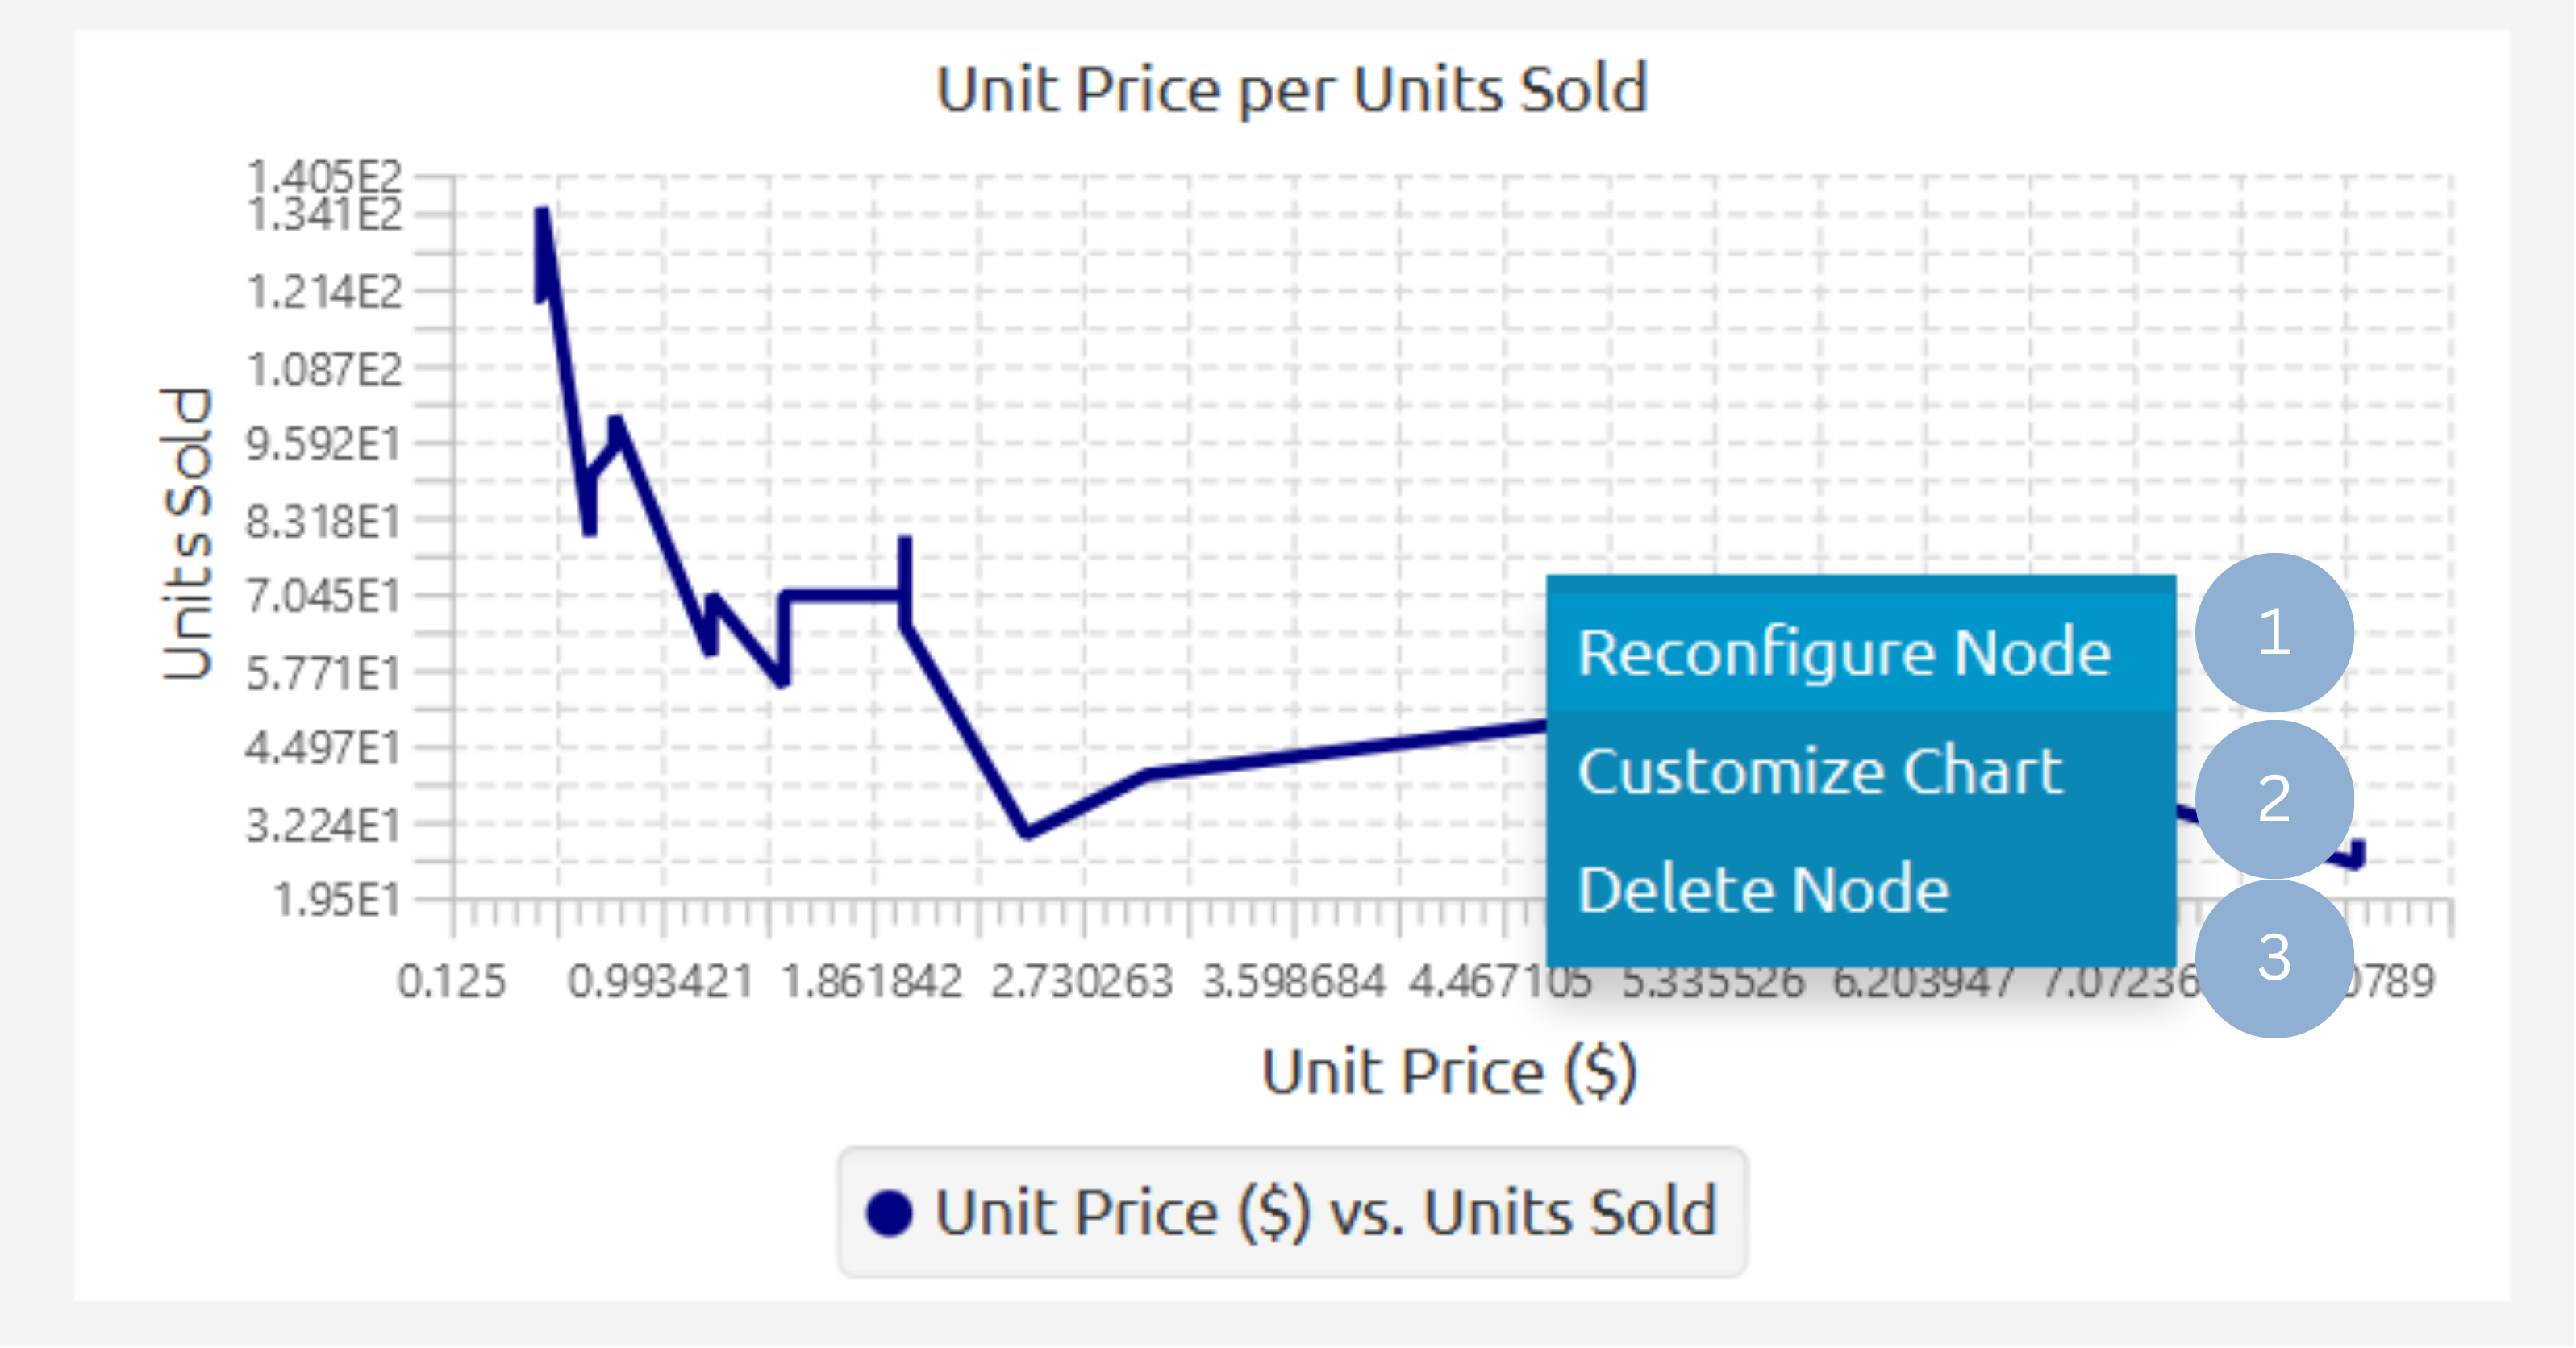
By right-clicking on the plot, it can be reconfigured (1), customized (2), or deleted (3).
Add Label
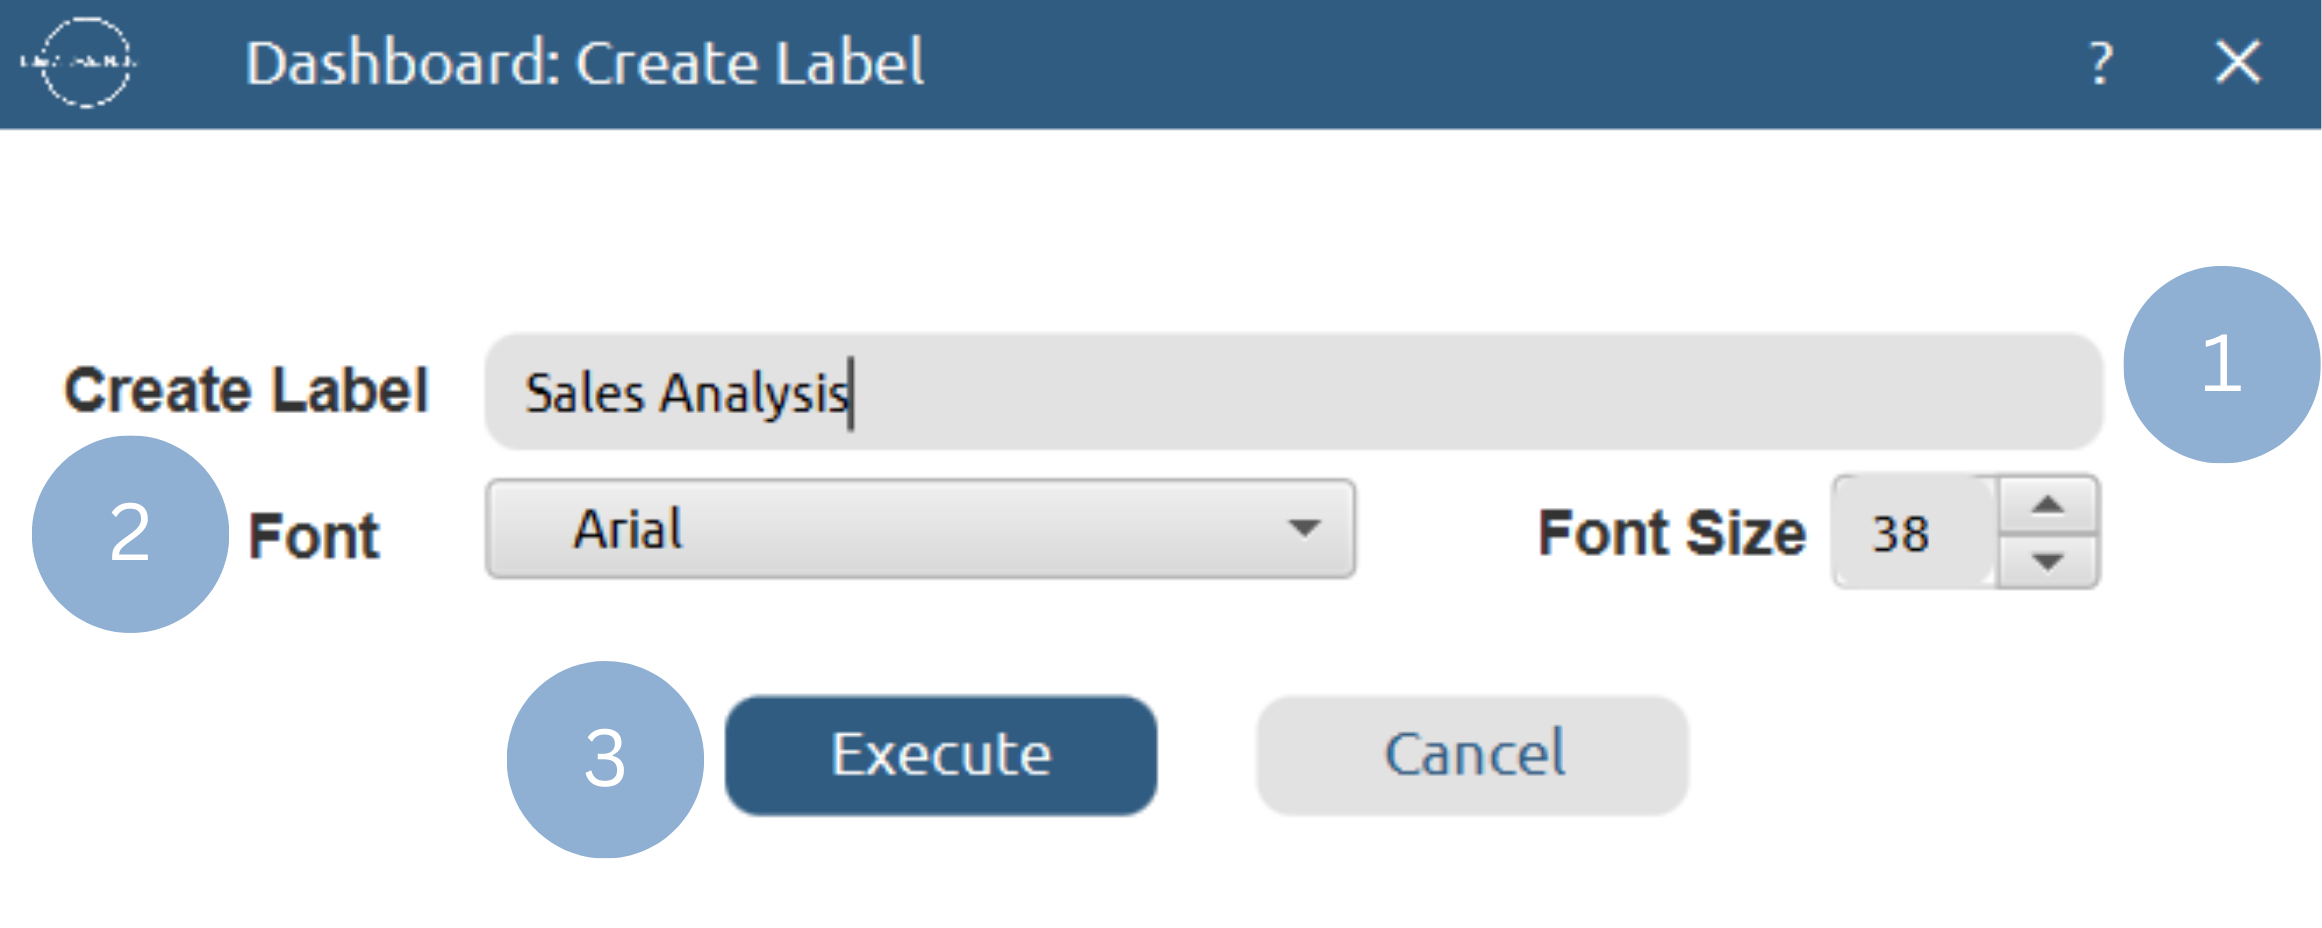
To add a label to the dashboard, select Add Label. You can add the label as a simple title (1) or as a title paired with a value sourced from any Isalos input sheet (2).

To add a simple title, enter the title text (1), choose the font and font size (2), and click Execute (3). The label can be moved and resized like any other element on the dashboard.
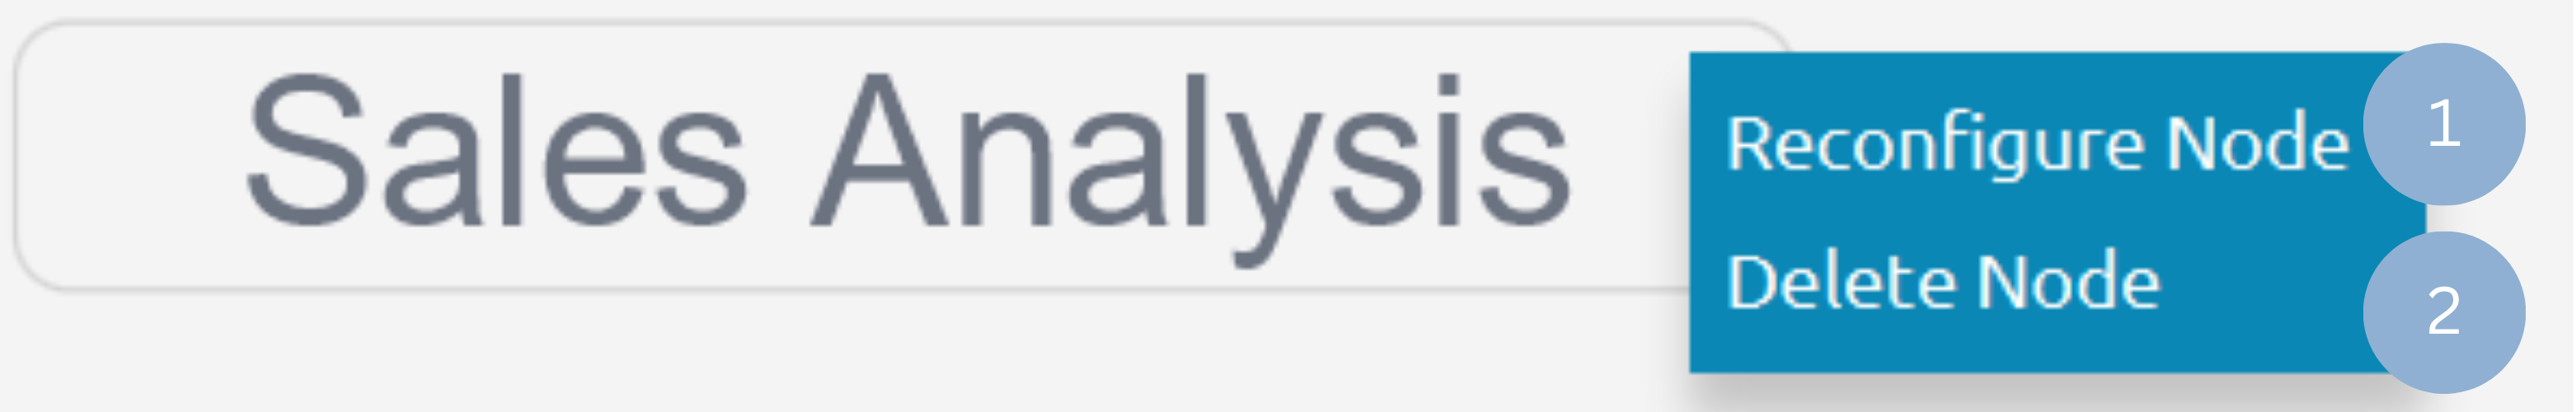
By right-clicking on the label, it can be reconfigured (1) or deleted (2).
To add a title and value, enter the title text (1), select the font and font size (2), choose the desired input sheet and value (3), and specify the number of decimal places (4). Finally, click Execute (5) to create the title and value label. The label can be moved and resized like any other element on the dashboard.

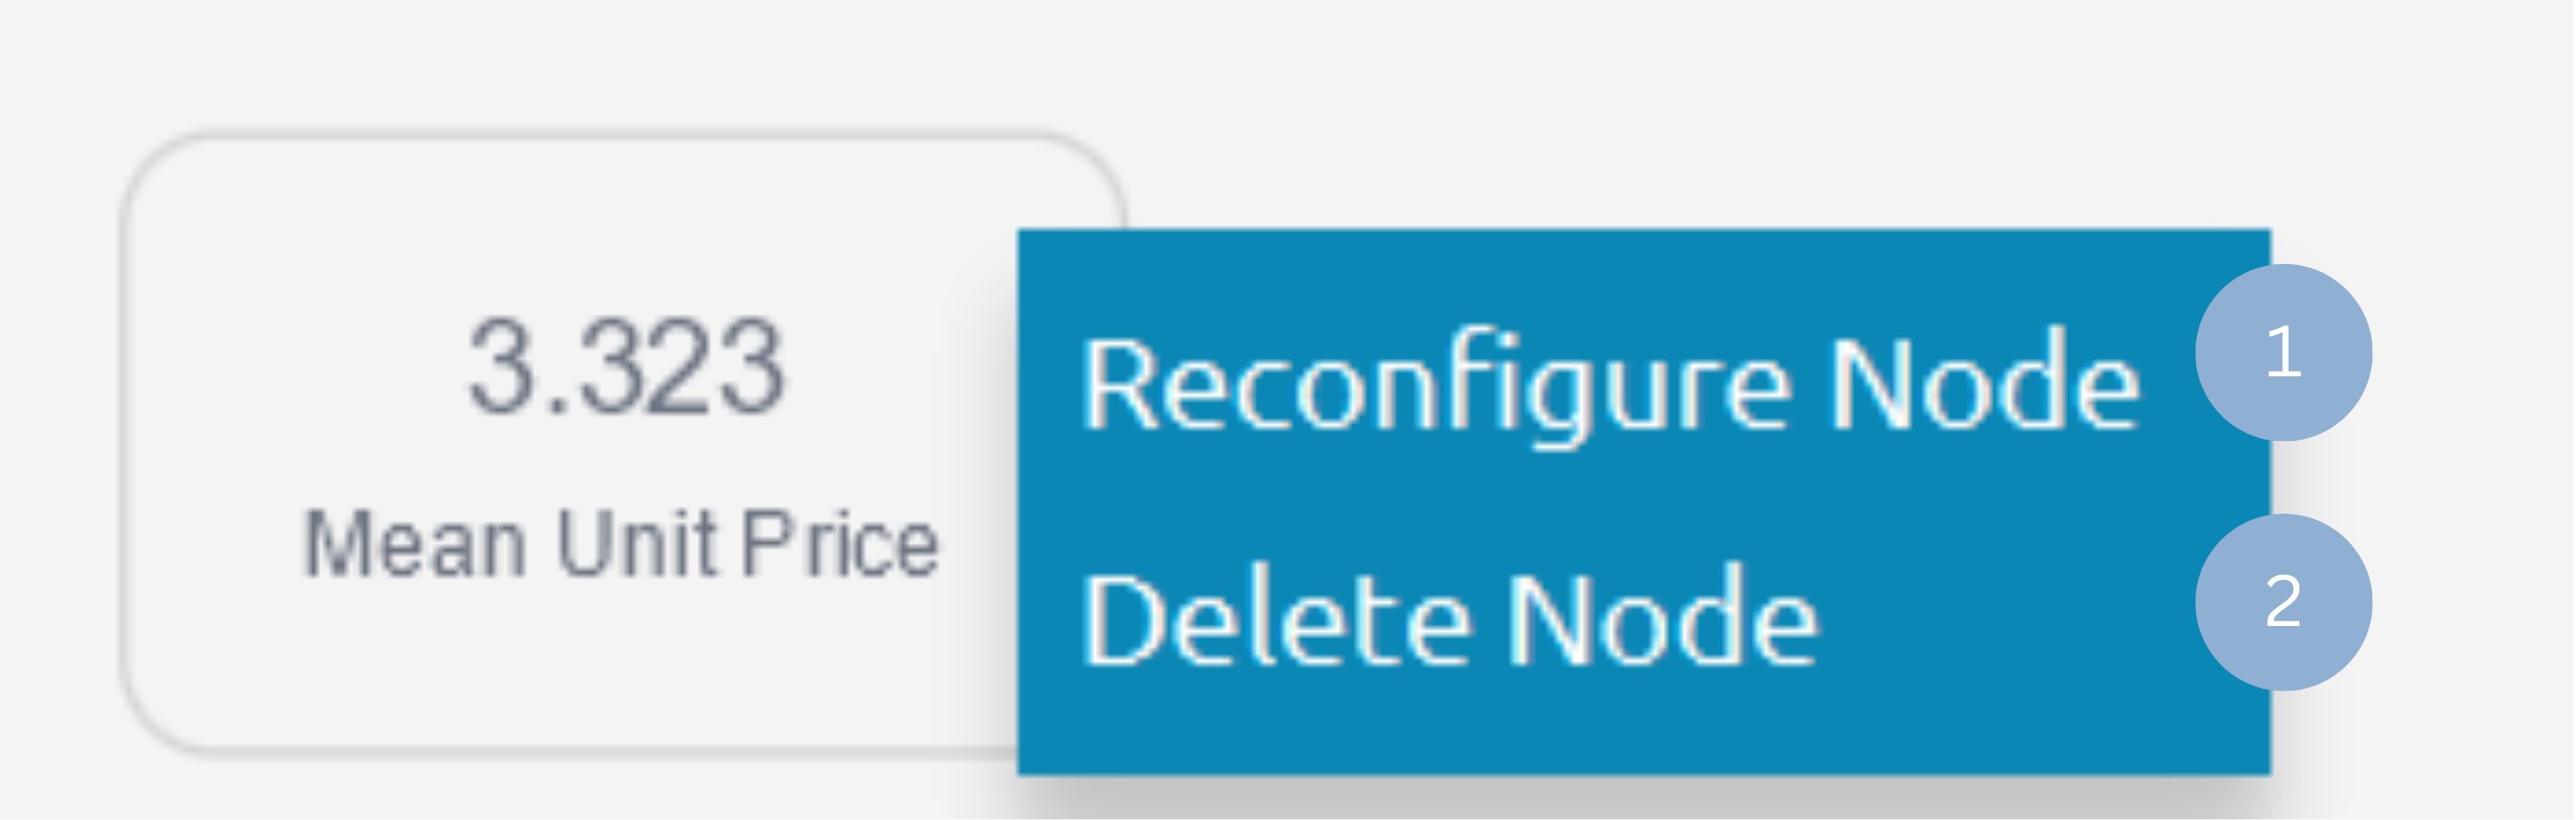
By right-clicking on the title and value label, it can be reconfigured (1) or deleted (2).
Manipulate Dashboard
The Isalos dashboard is fully editable, allowing each element to be repositioned through drag‑and‑drop interaction and resized by adjusting its corner handles.
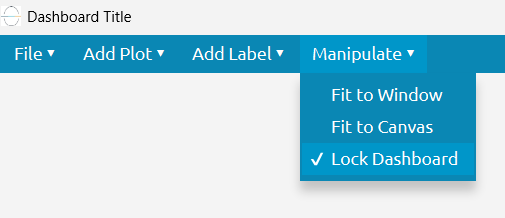
To edit the dashboard, the Lock Dashboard checkbox must be disabled, from the dashboard top ribbon:
| Manipulate \(\rightarrow\) Lock Dashboard |
To control how elements are displayed on the dashboard, the Fit to Window checkbox and Fit to Canvas button provide quick layout adjustments that adapt the view to the available space.
The Fit to Window option automatically scales and repositions all dashboard elements so that the entire layout fits within the current dashboard window. This ensures that users can view the full dashboard without scrolling, with every component resized proportionally.
The Fit to Canvas expands elements to make optimal use of the available canvas space. It enlarges components as much as possible while maintaining their relative layout and avoiding overlap when possible, resulting in a fuller, more spacious presentation of the dashboard content.
| Manipulate \(\rightarrow\) Fit to Window |
| Manipulate \(\rightarrow\) Fit to Canvas |
The above manipulation options can be found in the top dasbhoard ribbon under Manipulate
Save Dashboard
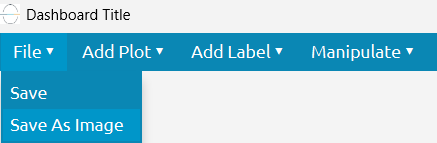
To save the dashboard changes in the isalos project, select Save.
| File \(\rightarrow\) Save |
To export the dashboard as a PNG image, select Save As Image, then specify the desired file name and save location.
| File \(\rightarrow\) Save As Image |
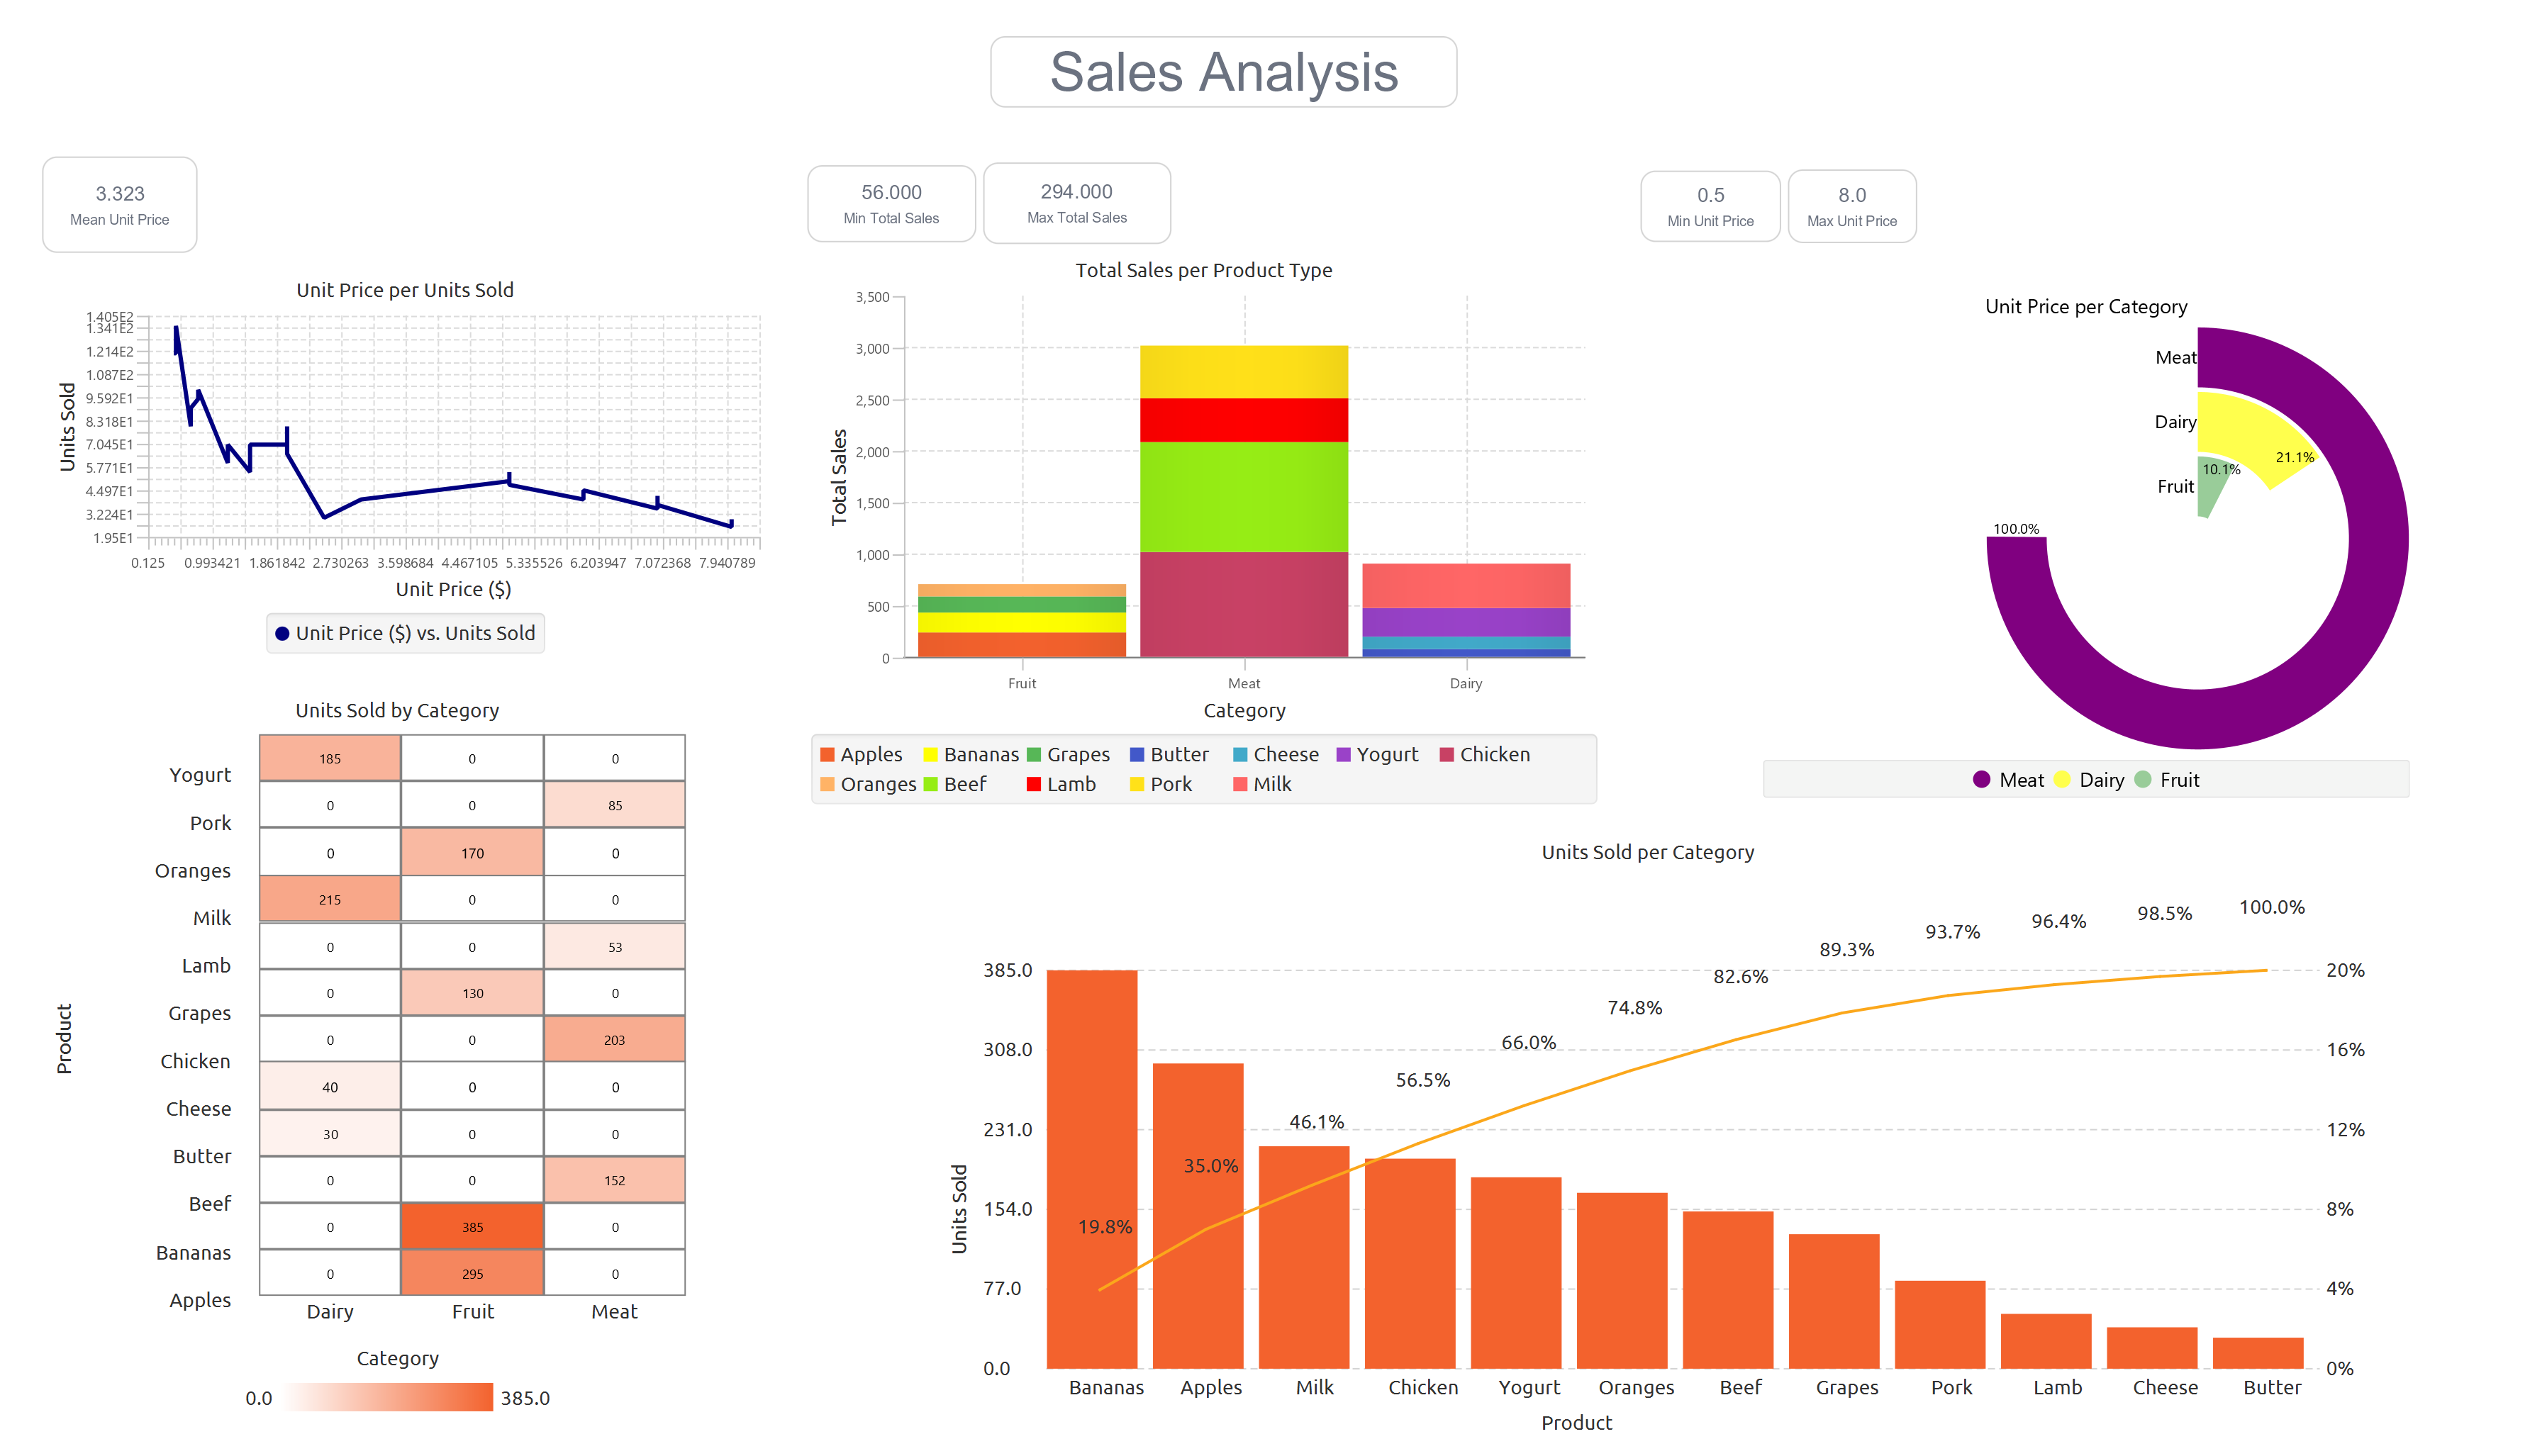
Example Dashboard
An example of an Isalos dashboard, including labels and plots, is shown below.
Version History
Introduced in Isalos Analytics Platform v2.0.0
Instructions last updated on December 2025